| Red | Green | Blue | |
| z | 17.64 | ||
| znorm | Inf | ||
| sky | -Inf | -Inf | -Inf |
| S/N | 21.2 | 36.8 | 42.3 |
| S/N(c) | 0.0 | 0.0 | 0.0 |
| SN(E/C) |
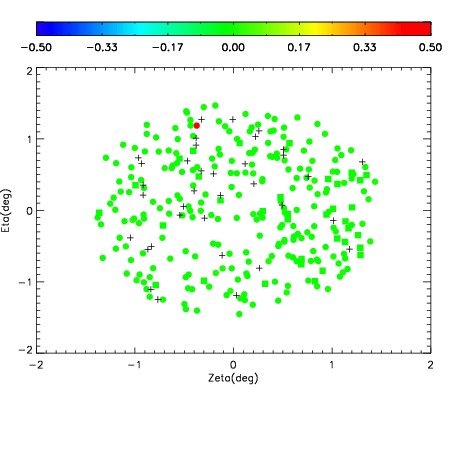
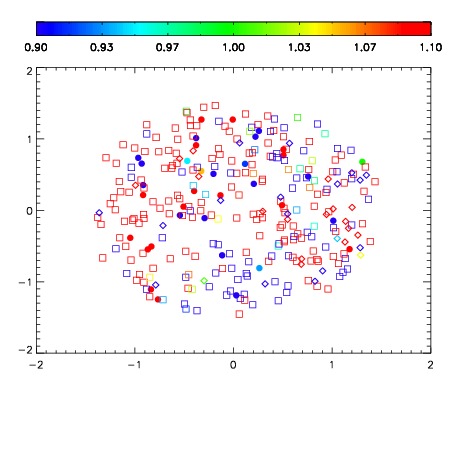
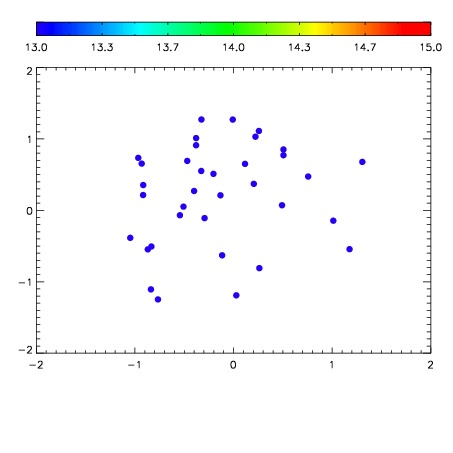

| Frame | Nreads | Zeropoints | Mag plots | Spatial mag deviation | Spatial sky 16325A emission deviations (filled: sky, open: star) | Spatial sky continuum emission | Spatial sky telluric CO2 absorption deviations (filled: H < 10) | |||||||||||||||||||||||
| 0 | 0 |
|
|
|
|
|
|
| IPAIR | NAME | SHIFT | NEWSHIFT | S/N | NAME | SHIFT | NEWSHIFT | S/N |
| 0 | 06770027 | 0.484731 | 0.00000 | 178.008 | 06770028 | -0.00311865 | 0.487850 | 199.965 |
| 1 | 06770031 | 0.483925 | 0.000805974 | 185.703 | 06770032 | 0.00186778 | 0.482863 | 206.975 |
| 2 | 06770026 | 0.483995 | 0.000735998 | 184.705 | 06770025 | 0.00000 | 0.484731 | 200.616 |
| 3 | 06770030 | 0.483371 | 0.00136000 | 165.645 | 06770029 | -0.00219403 | 0.486925 | 190.656 |