| Red | Green | Blue | |
| z | 17.64 | ||
| znorm | Inf | ||
| sky | -Inf | -Inf | -Inf |
| S/N | 26.7 | 46.2 | 52.4 |
| S/N(c) | 0.0 | 0.0 | 0.0 |
| SN(E/C) |

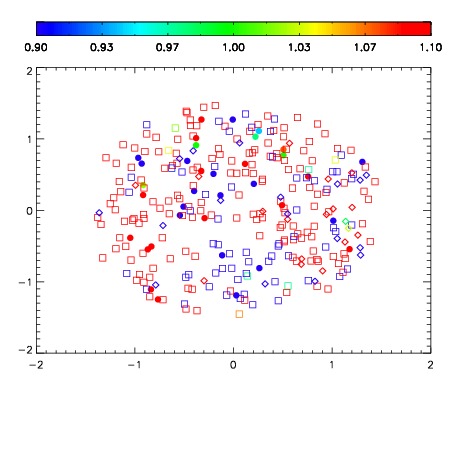
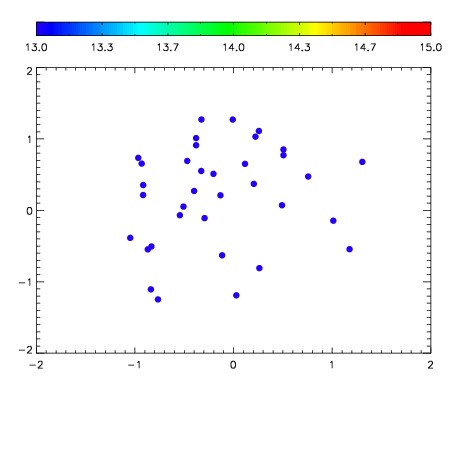

| Frame | Nreads | Zeropoints | Mag plots | Spatial mag deviation | Spatial sky 16325A emission deviations (filled: sky, open: star) | Spatial sky continuum emission | Spatial sky telluric CO2 absorption deviations (filled: H < 10) | |||||||||||||||||||||||
| 0 | 0 |
|
|
|
|
|
|
| IPAIR | NAME | SHIFT | NEWSHIFT | S/N | NAME | SHIFT | NEWSHIFT | S/N |
| 0 | 07000077 | 0.484541 | 0.00000 | 218.666 | 07000076 | 0.00261831 | 0.481923 | 218.341 |
| 1 | 07000074 | 0.484191 | 0.000349998 | 224.518 | 07000075 | 0.00264969 | 0.481891 | 221.959 |
| 2 | 07000078 | 0.484474 | 6.69956e-05 | 216.798 | 07000079 | 0.00422708 | 0.480314 | 216.429 |
| 3 | 07000073 | 0.483673 | 0.000867993 | 215.484 | 07000072 | 0.00000 | 0.484541 | 209.797 |