| Red | Green | Blue | |
| z | 17.64 | ||
| znorm | Inf | ||
| sky | -Inf | -Inf | -Inf |
| S/N | 16.6 | 31.5 | 36.0 |
| S/N(c) | 0.0 | 0.0 | 0.0 |
| SN(E/C) |
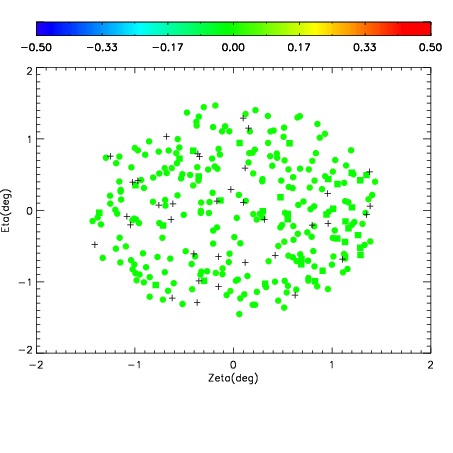
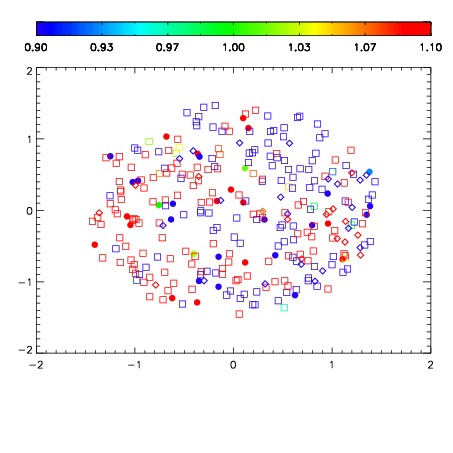
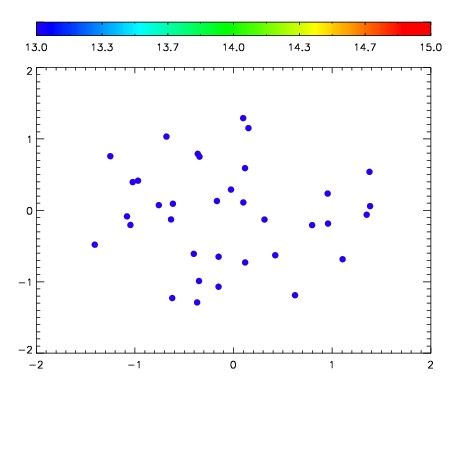

| Frame | Nreads | Zeropoints | Mag plots | Spatial mag deviation | Spatial sky 16325A emission deviations (filled: sky, open: star) | Spatial sky continuum emission | Spatial sky telluric CO2 absorption deviations (filled: H < 10) | |||||||||||||||||||||||
| 0 | 0 |
|
|
|
|
|
|
| IPAIR | NAME | SHIFT | NEWSHIFT | S/N | NAME | SHIFT | NEWSHIFT | S/N |
| 0 | 06920076 | 0.497496 | 0.00000 | 168.561 | 06920074 | 0.00000 | 0.497496 | 173.526 |
| 1 | 06920075 | 0.497139 | 0.000357002 | 165.434 | 06920077 | 0.00381065 | 0.493685 | 161.844 |
| 2 | 06920080 | 0.493065 | 0.00443101 | 147.736 | 06920081 | 0.00535649 | 0.492140 | 133.489 |
| 3 | 06920079 | 0.492439 | 0.00505701 | 144.426 | 06920078 | 0.00181161 | 0.495684 | 129.671 |