| Red | Green | Blue | |
| z | 17.64 | ||
| znorm | Inf | ||
| sky | -Inf | -Inf | -Inf |
| S/N | 35.6 | 55.1 | 65.4 |
| S/N(c) | 0.0 | 0.0 | 0.0 |
| SN(E/C) |
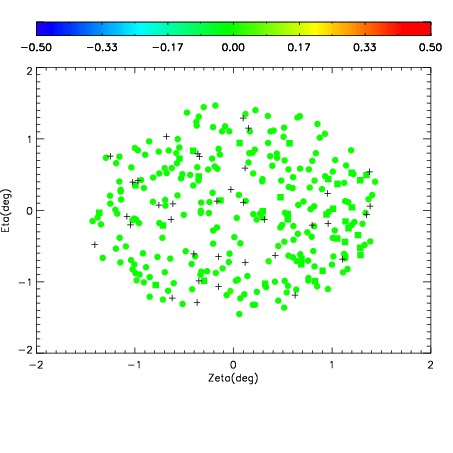
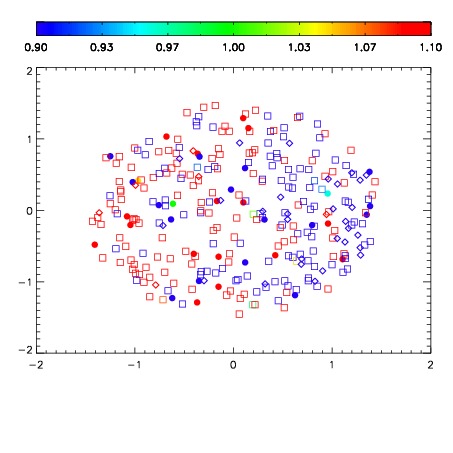
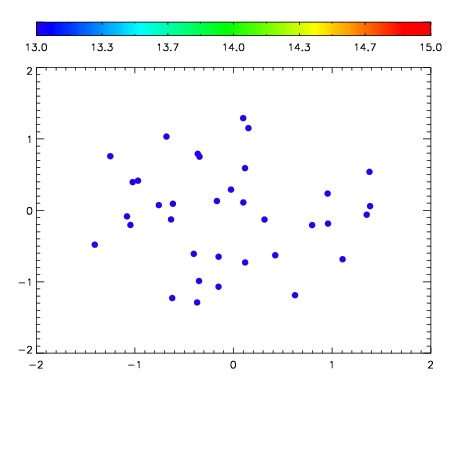

| Frame | Nreads | Zeropoints | Mag plots | Spatial mag deviation | Spatial sky 16325A emission deviations (filled: sky, open: star) | Spatial sky continuum emission | Spatial sky telluric CO2 absorption deviations (filled: H < 10) | |||||||||||||||||||||||
| 0 | 0 |
|
|
|
|
|
|
| IPAIR | NAME | SHIFT | NEWSHIFT | S/N | NAME | SHIFT | NEWSHIFT | S/N |
| 0 | 06970052 | 0.491546 | 0.00000 | 225.965 | 06970053 | 0.00598852 | 0.485557 | 224.329 |
| 1 | 06970048 | 0.488496 | 0.00305000 | 226.977 | 06970050 | 0.00255734 | 0.488989 | 224.820 |
| 2 | 06970051 | 0.489833 | 0.00171301 | 226.114 | 06970049 | 0.00184537 | 0.489701 | 224.786 |
| 3 | 06970055 | 0.489368 | 0.00217801 | 220.804 | 06970057 | 0.00464028 | 0.486906 | 223.477 |
| 4 | 06970056 | 0.490397 | 0.00114900 | 218.968 | 06970054 | 0.00508693 | 0.486459 | 220.577 |
| 5 | 06970047 | 0.487941 | 0.00360501 | 216.392 | 06970046 | 0.00000 | 0.491546 | 213.103 |