| Red | Green | Blue | |
| z | 17.64 | ||
| znorm | Inf | ||
| sky | -Inf | -Inf | -Inf |
| S/N | 15.5 | 29.7 | 34.0 |
| S/N(c) | 0.0 | 0.0 | 0.0 |
| SN(E/C) |
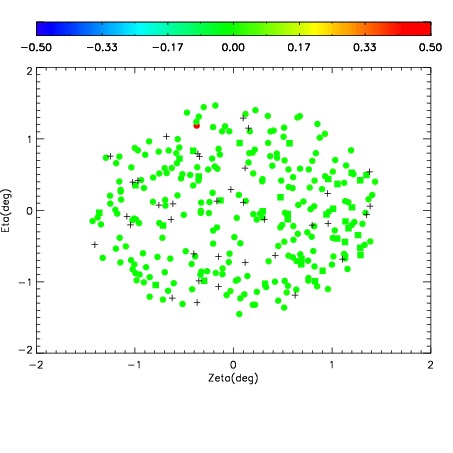
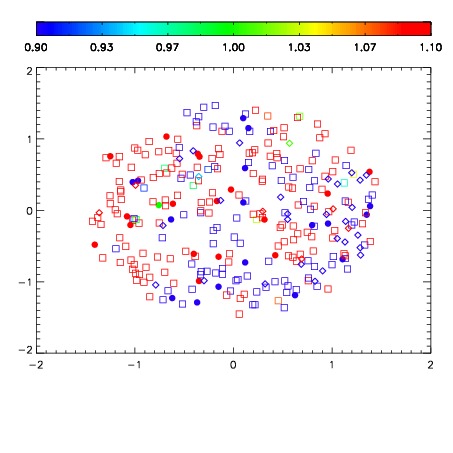
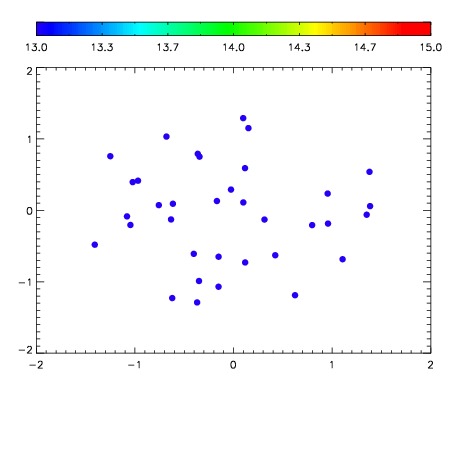

| Frame | Nreads | Zeropoints | Mag plots | Spatial mag deviation | Spatial sky 16325A emission deviations (filled: sky, open: star) | Spatial sky continuum emission | Spatial sky telluric CO2 absorption deviations (filled: H < 10) | |||||||||||||||||||||||
| 0 | 0 |
|
|
|
|
|
|
| IPAIR | NAME | SHIFT | NEWSHIFT | S/N | NAME | SHIFT | NEWSHIFT | S/N |
| 0 | 07200054 | 0.471875 | 0.00000 | 152.821 | 07200051 | -0.00625639 | 0.478131 | 155.221 |
| 1 | 07200053 | 0.470243 | 0.00163200 | 167.406 | 07200052 | -0.00778859 | 0.479664 | 173.314 |
| 2 | 07200050 | 0.470236 | 0.00163901 | 113.014 | 07200048 | 0.00000 | 0.471875 | 146.931 |
| 3 | 07200049 | 0.469575 | 0.00230002 | 110.393 | 07200055 | -0.00577256 | 0.477648 | 112.700 |