| Red | Green | Blue | |
| z | 17.64 | ||
| znorm | Inf | ||
| sky | -Inf | -Inf | -Inf |
| S/N | 28.9 | 49.2 | 54.4 |
| S/N(c) | 0.0 | 0.0 | 0.0 |
| SN(E/C) |
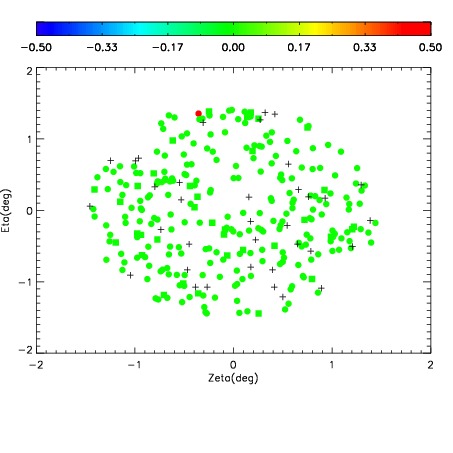
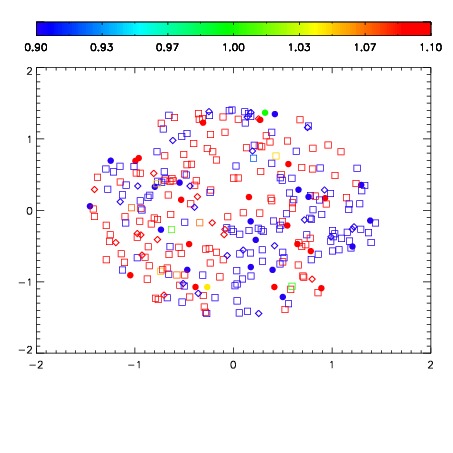
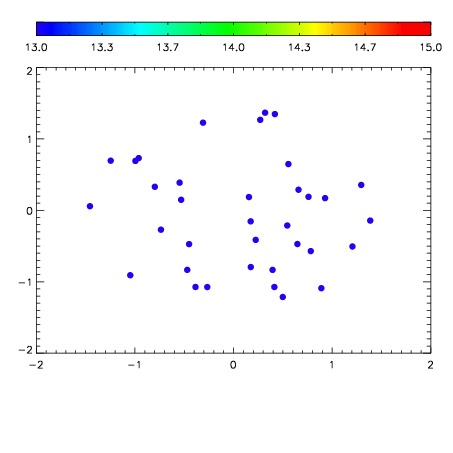

| Frame | Nreads | Zeropoints | Mag plots | Spatial mag deviation | Spatial sky 16325A emission deviations (filled: sky, open: star) | Spatial sky continuum emission | Spatial sky telluric CO2 absorption deviations (filled: H < 10) | |||||||||||||||||||||||
| 0 | 0 |
|
|
|
|
|
|
| IPAIR | NAME | SHIFT | NEWSHIFT | S/N | NAME | SHIFT | NEWSHIFT | S/N |
| 0 | 07050043 | 0.467190 | 0.00000 | 203.520 | 07050037 | 0.00000 | 0.467190 | 199.423 |
| 1 | 07050039 | 0.465388 | 0.00180200 | 213.197 | 07050044 | 0.00143933 | 0.465751 | 211.837 |
| 2 | 07050038 | 0.463522 | 0.00366801 | 207.729 | 07050040 | 0.00198857 | 0.465201 | 209.110 |
| 3 | 07050042 | 0.466315 | 0.000874996 | 204.113 | 07050041 | 0.00318252 | 0.464007 | 205.816 |