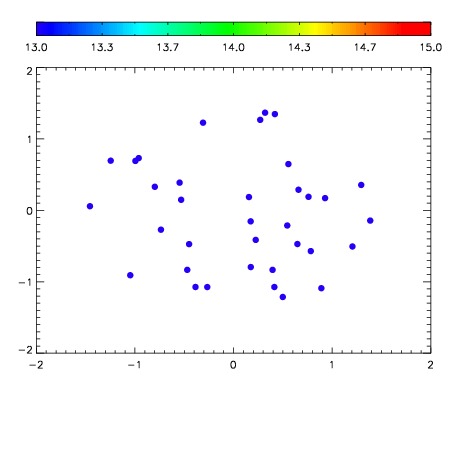
| Frame | Nreads | Zeropoints | Mag plots
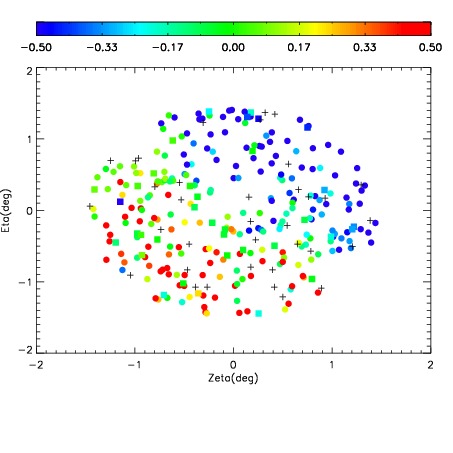
| Spatial mag deviation
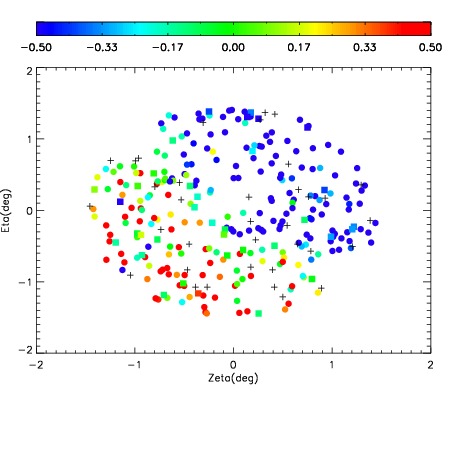
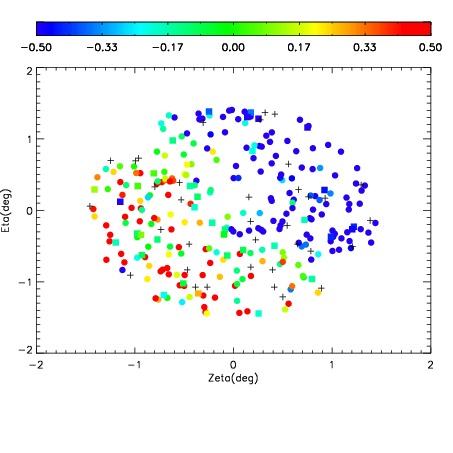
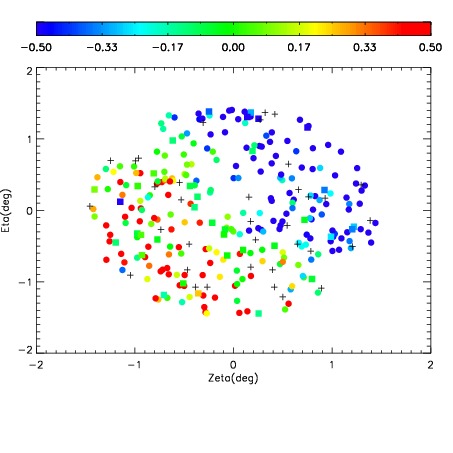
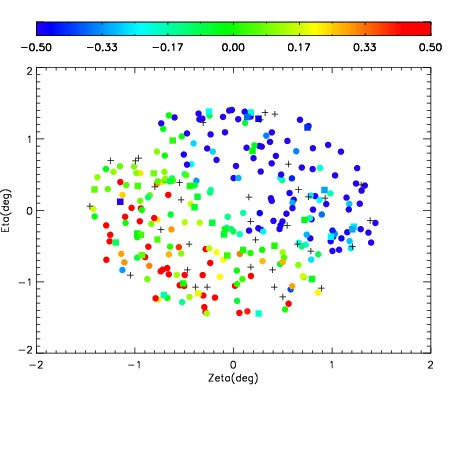
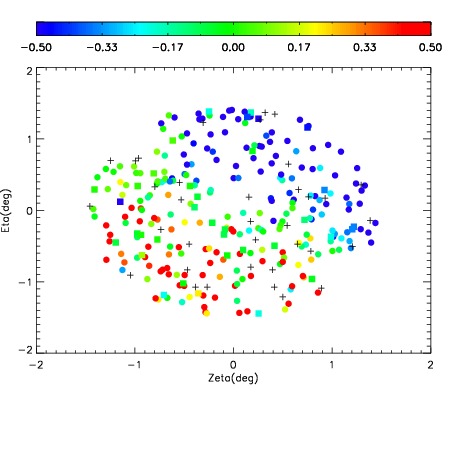
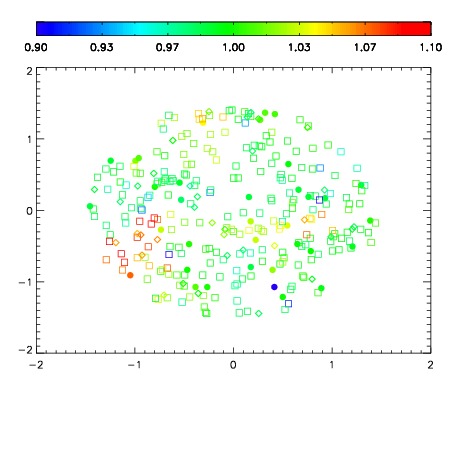
| Spatial sky 16325A emission deviations (filled: sky, open: star)
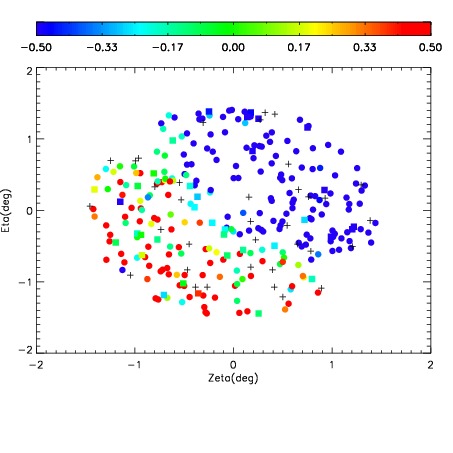
| Spatial sky continuum emission
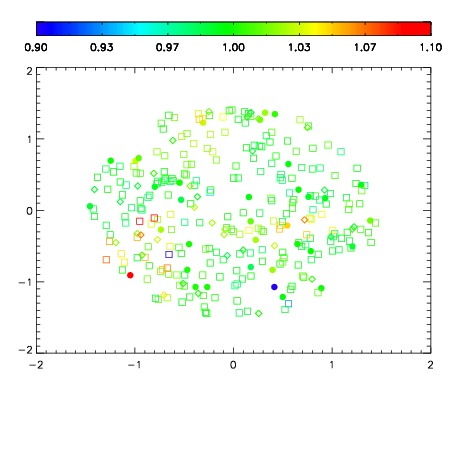
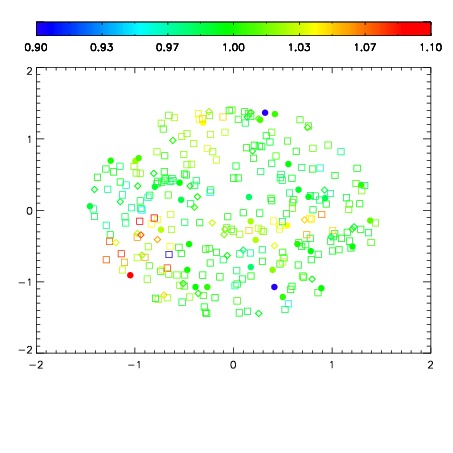
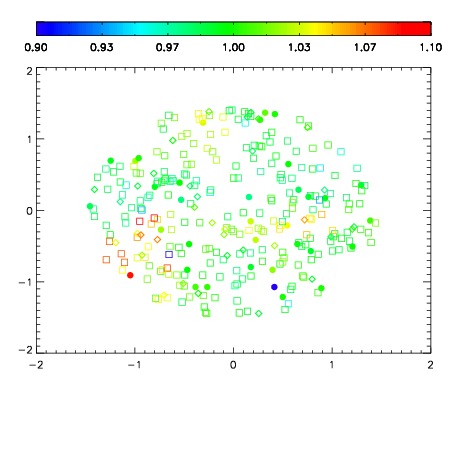
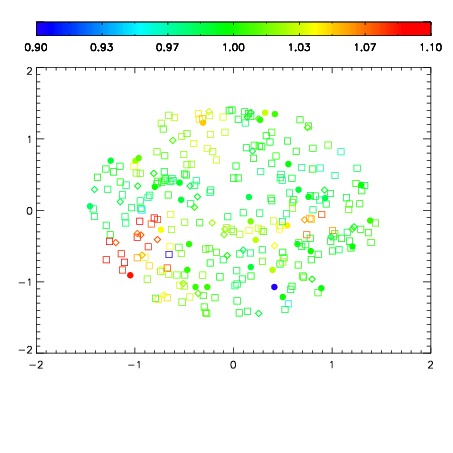
| Spatial sky telluric CO2 absorption deviations (filled: H < 10)
|
| 7260075
| 47
| | Red | Green | Blue
| | z | | 16.11
| | znorm | | 11.93
| | sky | 11.4 | 11.3 | 11.3
| | S/N | 0.5 | 0.8 | 1.0
| | S/N(c) | 0.6 | 1.1 | 1.6
| | SN(E/C) 1.00
|
| 
| 
| 
| 
| 
|
| 7260076
| 47
| | Red | Green | Blue
| | z | | 16.18
| | znorm | | 12.00
| | sky | 11.4 | 11.3 | 11.3
| | S/N | 0.6 | 1.4 | 1.4
| | S/N(c) | 0.7 | 1.1 | 1.6
| | SN(E/C) 1.02
|
| 
| 
| 
| 
| 
|
| 7260077
| 47
| | Red | Green | Blue
| | z | | 16.67
| | znorm | | 12.49
| | sky | 11.4 | 11.3 | 11.2
| | S/N | 1.0 | 1.9 | 2.3
| | S/N(c) | 1.1 | 1.8 | 2.3
| | SN(E/C) 1.00
|
| 
| 
| 
| 
| 
|
| 7260078
| 47
| | Red | Green | Blue
| | z | | 17.05
| | znorm | | 12.87
| | sky | 11.3 | 11.2 | 11.1
| | S/N | 1.6 | 2.4 | 2.6
| | S/N(c) | 1.6 | 2.4 | 3.1
| | SN(E/C) 0.98
|
| 
| 
| 
| 
| 
|
| 7260079
| 47
| | Red | Green | Blue
| | z | | 17.42
| | znorm | | 13.24
| | sky | 11.2 | 11.1 | 11.0
| | S/N | 1.9 | 2.5 | 4.1
| | S/N(c) | 2.1 | 3.4 | 4.4
| | SN(E/C) 1.00
|
| 
| 
| 
| 
| 
|
| 7260080
| 47
| | Red | Green | Blue
| | z | | 15.98
| | znorm | | 11.80
| | sky | 11.2 | 11.1 | 11.0
| | S/N | 0.2 | 0.2 | 1.0
| | S/N(c) | 0.4 | 0.7 | 1.3
| | SN(E/C) 1.04
|
| 
| 
| 
| 
| 
|
| 7260081
| 47
| | Red | Green | Blue
| | z | | 16.58
| | znorm | | 12.40
| | sky | 11.1 | 11.0 | 10.9
| | S/N | 0.8 | 0.5 | 1.6
| | S/N(c) | 0.9 | 1.4 | 2.2
| | SN(E/C) 1.02
|
| 
| 
| 
| 
| 
|
| 7260082
| 47
| | Red | Green | Blue
| | z | | 17.22
| | znorm | | 13.03
| | sky | 11.3 | 11.1 | 11.0
| | S/N | 2.2 | 3.1 | 3.1
| | S/N(c) | 1.9 | 2.9 | 3.9
| | SN(E/C) 0.97
|
| 
| 
| 
| 
| 
|