| Red | Green | Blue | |
| z | 17.63 | ||
| znorm | Inf | ||
| sky | -NaN | -NaN | -Inf |
| S/N | 2.4 | 3.8 | 4.9 |
| S/N(c) | 0.0 | 0.0 | 0.0 |
| SN(E/C) |
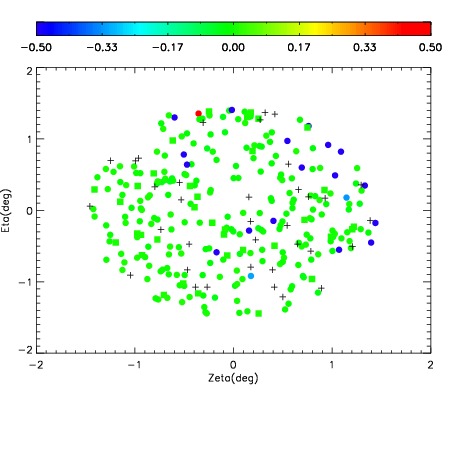
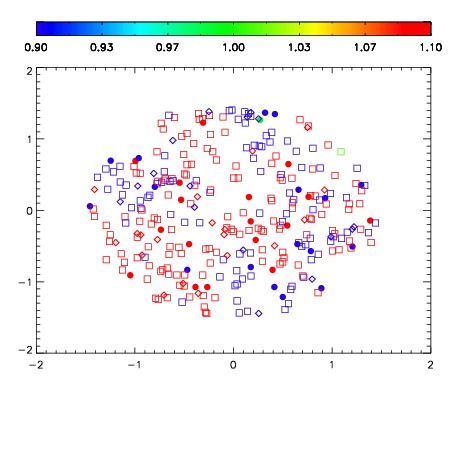
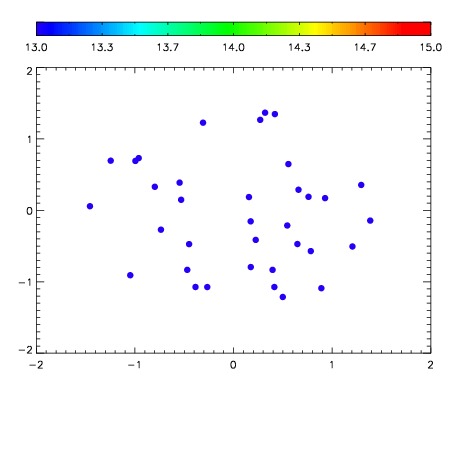

| Frame | Nreads | Zeropoints | Mag plots | Spatial mag deviation | Spatial sky 16325A emission deviations (filled: sky, open: star) | Spatial sky continuum emission | Spatial sky telluric CO2 absorption deviations (filled: H < 10) | |||||||||||||||||||||||
| 0 | 0 |
|
|
|
|
|
|
| IPAIR | NAME | SHIFT | NEWSHIFT | S/N | NAME | SHIFT | NEWSHIFT | S/N |
| 0 | 07260076 | 0.472201 | 0.00000 | 37.4464 | 07260078 | 0.00129221 | 0.470909 | 65.0576 |
| 1 | 07260077 | 0.471851 | 0.000349998 | 53.0696 | 07260079 | 0.00297428 | 0.469227 | 83.0924 |
| 2 | 07260081 | 0.471608 | 0.000592977 | 45.5023 | 07260082 | 0.00255933 | 0.469642 | 71.5240 |
| 3 | 07260080 | 0.471599 | 0.000601977 | 29.8521 | 07260075 | 0.00000 | 0.472201 | 37.2800 |