| Red | Green | Blue | |
| z | 17.64 | ||
| znorm | Inf | ||
| sky | -Inf | -Inf | -Inf |
| S/N | 32.7 | 54.7 | 60.9 |
| S/N(c) | 0.0 | 0.0 | 0.0 |
| SN(E/C) |
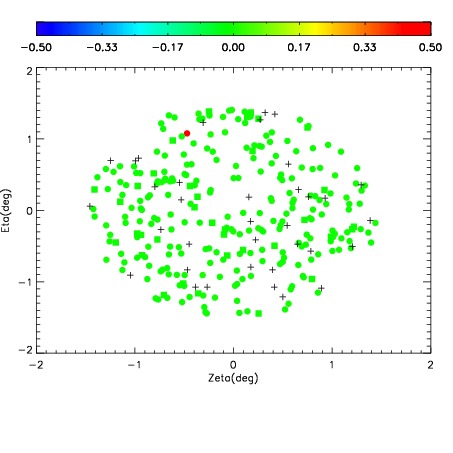
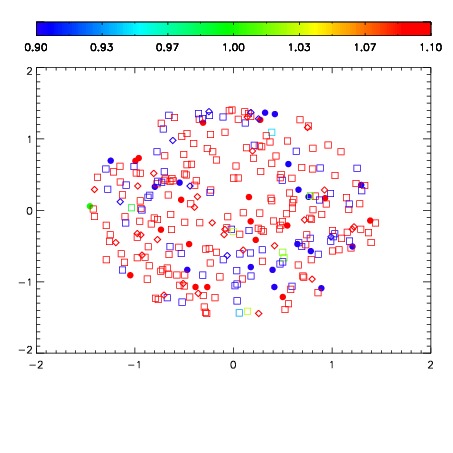
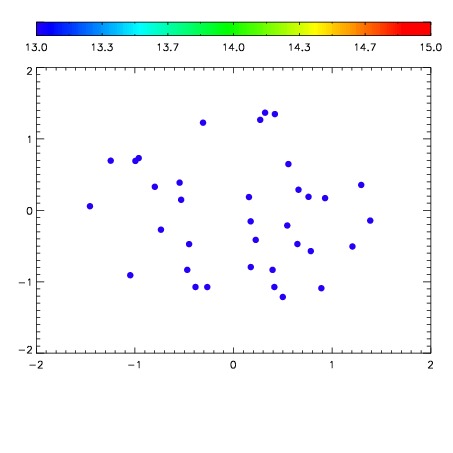

| Frame | Nreads | Zeropoints | Mag plots | Spatial mag deviation | Spatial sky 16325A emission deviations (filled: sky, open: star) | Spatial sky continuum emission | Spatial sky telluric CO2 absorption deviations (filled: H < 10) | |||||||||||||||||||||||
| 0 | 0 |
|
|
|
|
|
|
| IPAIR | NAME | SHIFT | NEWSHIFT | S/N | NAME | SHIFT | NEWSHIFT | S/N |
| 0 | 07520051 | 0.478354 | 0.00000 | 210.007 | 07520060 | 0.00584421 | 0.472510 | 214.122 |
| 1 | 07520050 | 0.477908 | 0.000446022 | 207.447 | 07520049 | 0.00000 | 0.478354 | 213.381 |
| 2 | 07520058 | 0.472645 | 0.00570899 | 206.137 | 07520056 | 0.00121396 | 0.477140 | 212.957 |
| 3 | 07520059 | 0.474238 | 0.00411600 | 202.704 | 07520052 | 0.00244350 | 0.475911 | 210.024 |
| 4 | 07520054 | 0.476715 | 0.00163901 | 201.600 | 07520057 | 0.00375667 | 0.474597 | 204.692 |
| 5 | 07520055 | 0.477295 | 0.00105900 | 201.454 | 07520053 | 1.02767e-05 | 0.478344 | 201.351 |