| Red | Green | Blue | |
| z | 17.64 | ||
| znorm | Inf | ||
| sky | -Inf | -Inf | -NaN |
| S/N | 22.1 | 40.7 | 44.1 |
| S/N(c) | 0.0 | 0.0 | 0.0 |
| SN(E/C) |
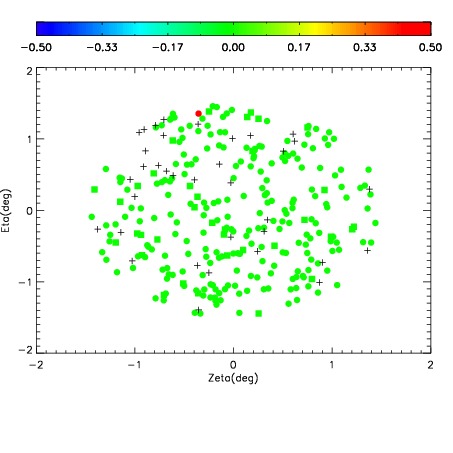
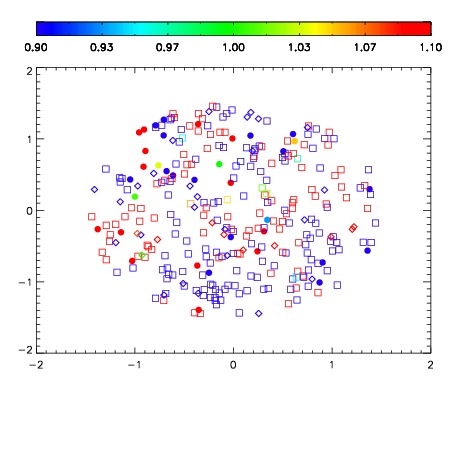
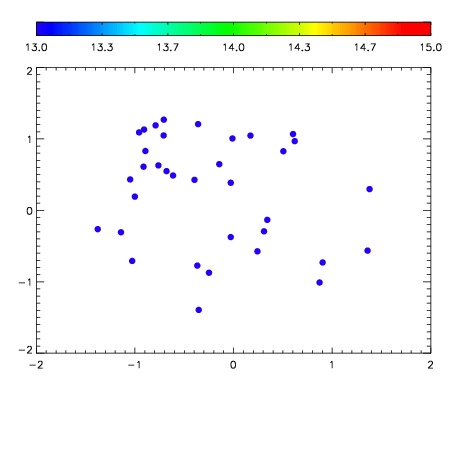

| Frame | Nreads | Zeropoints | Mag plots | Spatial mag deviation | Spatial sky 16325A emission deviations (filled: sky, open: star) | Spatial sky continuum emission | Spatial sky telluric CO2 absorption deviations (filled: H < 10) | |||||||||||||||||||||||
| 0 | 0 |
|
|
|
|
|
|
| IPAIR | NAME | SHIFT | NEWSHIFT | S/N | NAME | SHIFT | NEWSHIFT | S/N |
| 0 | 07280076 | 0.484326 | 0.00000 | 155.034 | 07280074 | 0.000105973 | 0.484220 | 164.762 |
| 1 | 07280072 | 0.483367 | 0.000959009 | 176.756 | 07280070 | 0.00000 | 0.484326 | 181.007 |
| 2 | 07280071 | 0.482536 | 0.00179002 | 166.979 | 07280073 | 0.00215933 | 0.482167 | 168.668 |
| 3 | 07280075 | 0.483845 | 0.000481009 | 154.738 | 07280077 | 0.00187191 | 0.482454 | 141.564 |