| Red | Green | Blue | |
| z | 17.64 | ||
| znorm | Inf | ||
| sky | -Inf | -Inf | -Inf |
| S/N | 26.6 | 45.3 | 48.4 |
| S/N(c) | 0.0 | 0.0 | 0.0 |
| SN(E/C) |
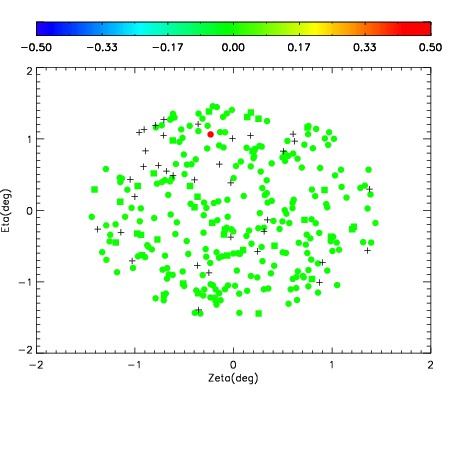
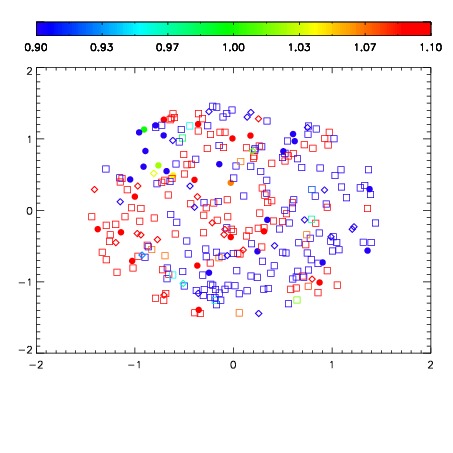


| Frame | Nreads | Zeropoints | Mag plots | Spatial mag deviation | Spatial sky 16325A emission deviations (filled: sky, open: star) | Spatial sky continuum emission | Spatial sky telluric CO2 absorption deviations (filled: H < 10) | |||||||||||||||||||||||
| 0 | 0 |
|
|
|
|
|
|
| IPAIR | NAME | SHIFT | NEWSHIFT | S/N | NAME | SHIFT | NEWSHIFT | S/N |
| 0 | 07530056 | 0.477536 | 0.00000 | 185.550 | 07530057 | 0.00306609 | 0.474470 | 186.184 |
| 1 | 07530051 | 0.475395 | 0.00214100 | 192.005 | 07530050 | 0.00000 | 0.477536 | 192.242 |
| 2 | 07530052 | 0.476325 | 0.00121099 | 188.977 | 07530053 | 0.00296404 | 0.474572 | 188.433 |
| 3 | 07530055 | 0.477043 | 0.000492990 | 182.716 | 07530054 | 0.000544925 | 0.476991 | 183.716 |