| Red | Green | Blue | |
| z | 17.64 | ||
| znorm | Inf | ||
| sky | -Inf | -Inf | -Inf |
| S/N | 19.8 | 37.6 | 40.7 |
| S/N(c) | 0.0 | 0.0 | 0.0 |
| SN(E/C) |
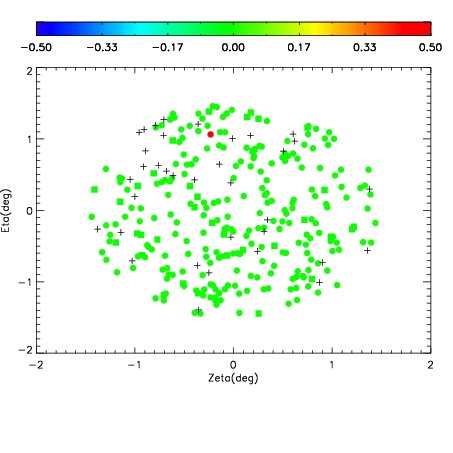
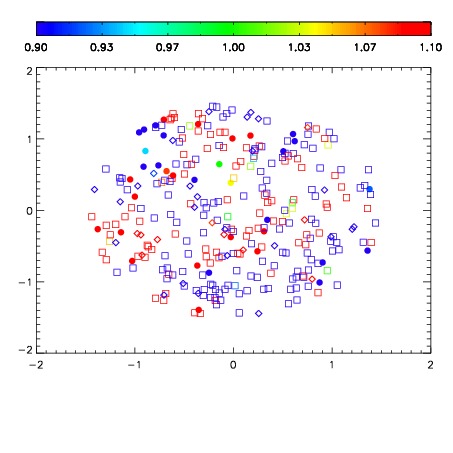
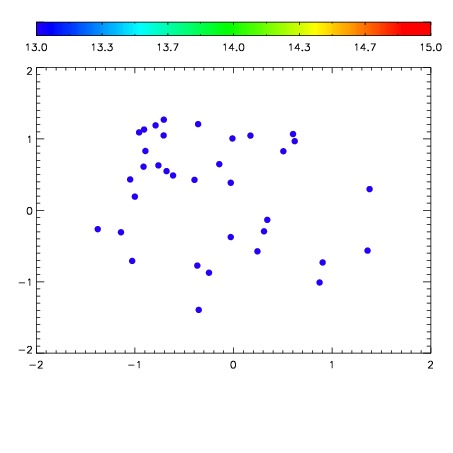

| Frame | Nreads | Zeropoints | Mag plots | Spatial mag deviation | Spatial sky 16325A emission deviations (filled: sky, open: star) | Spatial sky continuum emission | Spatial sky telluric CO2 absorption deviations (filled: H < 10) | |||||||||||||||||||||||
| 0 | 0 |
|
|
|
|
|
|
| IPAIR | NAME | SHIFT | NEWSHIFT | S/N | NAME | SHIFT | NEWSHIFT | S/N |
| 0 | 07610031 | 0.484618 | 0.00000 | 172.496 | 07610026 | 0.00000 | 0.484618 | 170.015 |
| 1 | 07610028 | 0.483938 | 0.000680000 | 175.641 | 07610029 | 0.00191670 | 0.482701 | 172.501 |
| 2 | 07610027 | 0.482314 | 0.00230402 | 175.188 | 07610030 | 0.00166914 | 0.482949 | 171.263 |
| 3 | 07610032 | 0.484589 | 2.89977e-05 | 152.454 | 07610033 | -0.000510579 | 0.485129 | 146.011 |