| Red | Green | Blue | |
| z | 17.64 | ||
| znorm | Inf | ||
| sky | -Inf | -Inf | -Inf |
| S/N | 26.9 | 45.4 | 48.6 |
| S/N(c) | 0.0 | 0.0 | 0.0 |
| SN(E/C) |
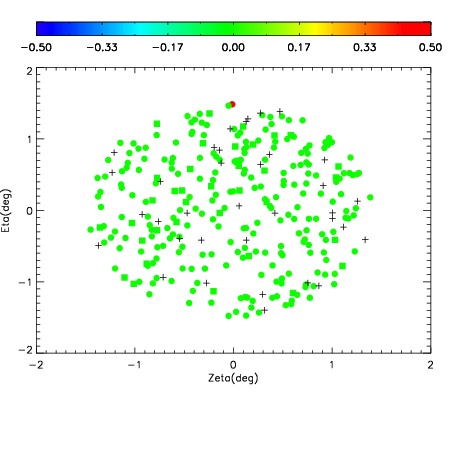
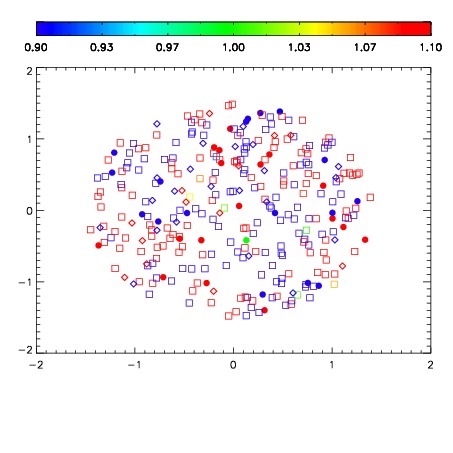
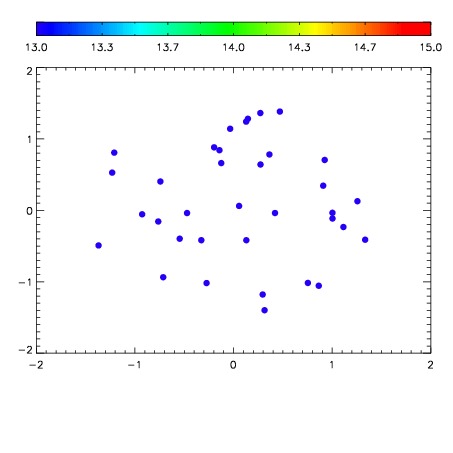

| Frame | Nreads | Zeropoints | Mag plots | Spatial mag deviation | Spatial sky 16325A emission deviations (filled: sky, open: star) | Spatial sky continuum emission | Spatial sky telluric CO2 absorption deviations (filled: H < 10) | |||||||||||||||||||||||
| 0 | 0 |
|
|
|
|
|
|
| IPAIR | NAME | SHIFT | NEWSHIFT | S/N | NAME | SHIFT | NEWSHIFT | S/N |
| 0 | 06390033 | 0.468145 | 0.00000 | 212.509 | 06390038 | -0.00780048 | 0.475946 | 211.782 |
| 1 | 06390032 | 0.467393 | 0.000752002 | 221.703 | 06390031 | 0.00000 | 0.468145 | 214.419 |
| 2 | 06390037 | 0.467042 | 0.00110301 | 209.726 | 06390034 | -0.0114113 | 0.479556 | 211.567 |
| 3 | 06390036 | 0.466614 | 0.00153100 | 199.505 | 06390035 | -0.00185164 | 0.469997 | 194.842 |