| Red | Green | Blue | |
| z | 17.64 | ||
| znorm | Inf | ||
| sky | -Inf | -Inf | -Inf |
| S/N | 26.7 | 43.9 | 46.5 |
| S/N(c) | 0.0 | 0.0 | 0.0 |
| SN(E/C) |
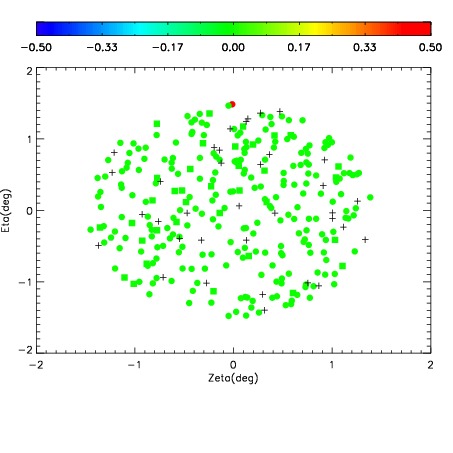
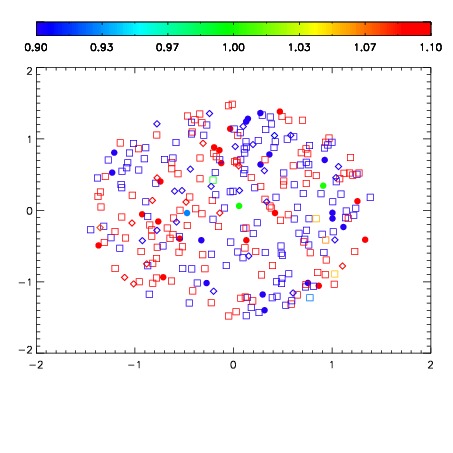
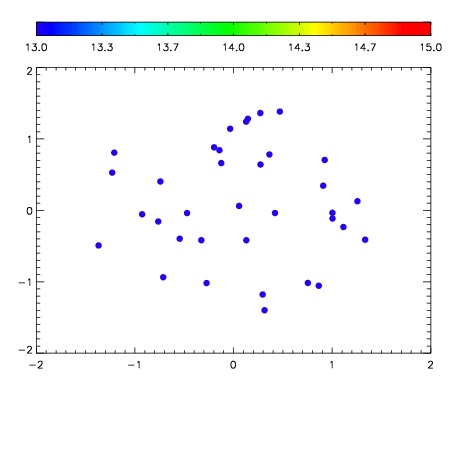

| Frame | Nreads | Zeropoints | Mag plots | Spatial mag deviation | Spatial sky 16325A emission deviations (filled: sky, open: star) | Spatial sky continuum emission | Spatial sky telluric CO2 absorption deviations (filled: H < 10) | |||||||||||||||||||||||
| 0 | 0 |
|
|
|
|
|
|
| IPAIR | NAME | SHIFT | NEWSHIFT | S/N | NAME | SHIFT | NEWSHIFT | S/N |
| 0 | 06460013 | 0.470617 | 0.00000 | 216.133 | 06460015 | -0.00571826 | 0.476335 | 201.044 |
| 1 | 06460012 | 0.470574 | 4.30048e-05 | 216.317 | 06460014 | -0.00480318 | 0.475420 | 210.786 |
| 2 | 06460016 | 0.469076 | 0.00154099 | 205.813 | 06460018 | 0.00158340 | 0.469034 | 188.523 |
| 3 | 06460017 | 0.469473 | 0.00114399 | 196.419 | 06460011 | 0.00000 | 0.470617 | 168.957 |