| Red | Green | Blue | |
| z | 17.64 | ||
| znorm | Inf | ||
| sky | -Inf | -Inf | -Inf |
| S/N | 28.0 | 48.1 | 51.8 |
| S/N(c) | 0.0 | 0.0 | 0.0 |
| SN(E/C) |
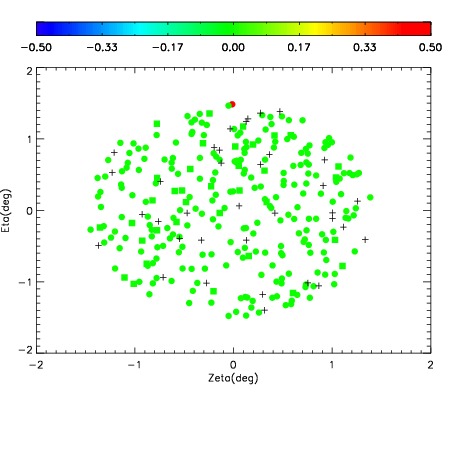
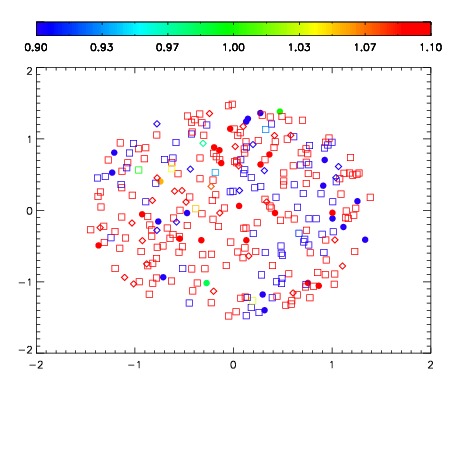
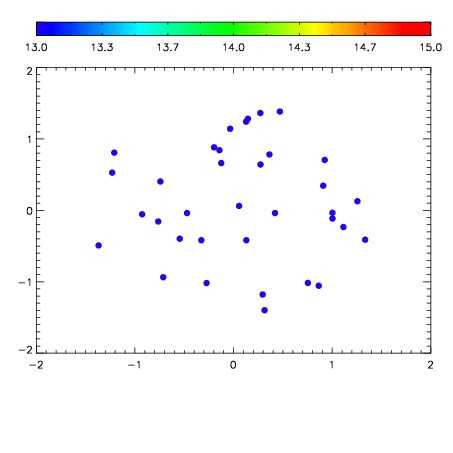

| Frame | Nreads | Zeropoints | Mag plots | Spatial mag deviation | Spatial sky 16325A emission deviations (filled: sky, open: star) | Spatial sky continuum emission | Spatial sky telluric CO2 absorption deviations (filled: H < 10) | |||||||||||||||||||||||
| 0 | 0 |
|
|
|
|
|
|
| IPAIR | NAME | SHIFT | NEWSHIFT | S/N | NAME | SHIFT | NEWSHIFT | S/N |
| 0 | 06650072 | 0.483443 | 0.00000 | 211.486 | 06650070 | 0.00000 | 0.483443 | 211.003 |
| 1 | 06650076 | 0.481244 | 0.00219899 | 212.664 | 06650073 | 0.00122568 | 0.482217 | 211.099 |
| 2 | 06650071 | 0.482625 | 0.000817984 | 210.405 | 06650074 | 0.000235012 | 0.483208 | 209.075 |
| 3 | 06650075 | 0.481613 | 0.00182998 | 207.085 | 06650077 | 0.00283152 | 0.480611 | 206.096 |