| Red | Green | Blue | |
| z | 17.64 | ||
| znorm | Inf | ||
| sky | -Inf | -Inf | -Inf |
| S/N | 28.3 | 48.9 | 54.8 |
| S/N(c) | 0.0 | 0.0 | 0.0 |
| SN(E/C) |
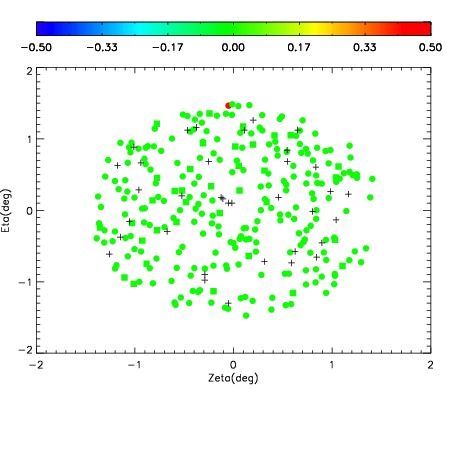
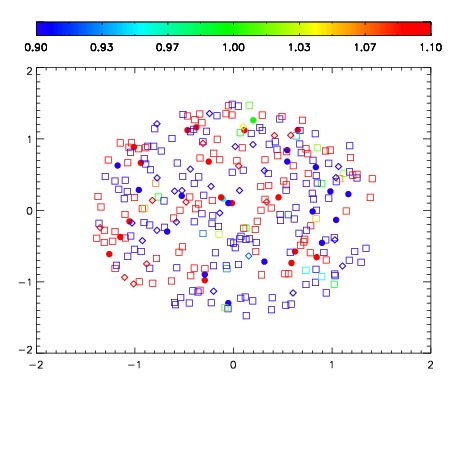
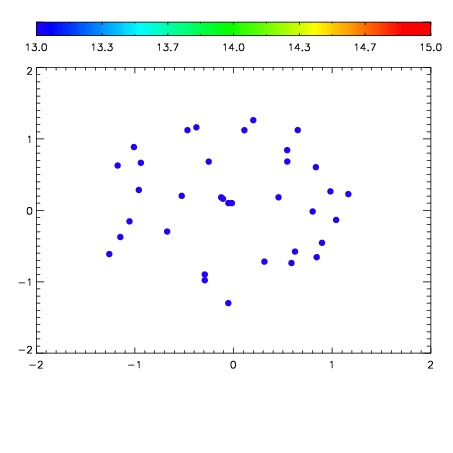

| Frame | Nreads | Zeropoints | Mag plots | Spatial mag deviation | Spatial sky 16325A emission deviations (filled: sky, open: star) | Spatial sky continuum emission | Spatial sky telluric CO2 absorption deviations (filled: H < 10) | |||||||||||||||||||||||
| 0 | 0 |
|
|
|
|
|
|
| IPAIR | NAME | SHIFT | NEWSHIFT | S/N | NAME | SHIFT | NEWSHIFT | S/N |
| 0 | 06410081 | 0.475537 | 0.00000 | 232.671 | 06410083 | -0.00112452 | 0.476662 | 236.172 |
| 1 | 06410085 | 0.473687 | 0.00185001 | 232.742 | 06410086 | 0.00203711 | 0.473500 | 238.618 |
| 2 | 06410080 | 0.475212 | 0.000324994 | 231.431 | 06410082 | 0.00153628 | 0.474001 | 231.320 |
| 3 | 06410084 | 0.473458 | 0.00207901 | 229.714 | 06410079 | 0.00000 | 0.475537 | 230.413 |