| Red | Green | Blue | |
| z | 17.64 | ||
| znorm | Inf | ||
| sky | -Inf | -Inf | -Inf |
| S/N | 27.7 | 48.6 | 53.5 |
| S/N(c) | 0.0 | 0.0 | 0.0 |
| SN(E/C) |
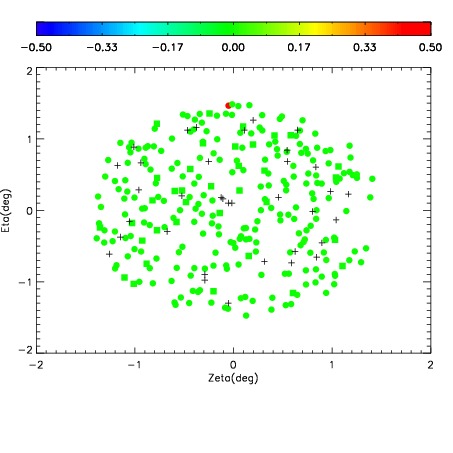
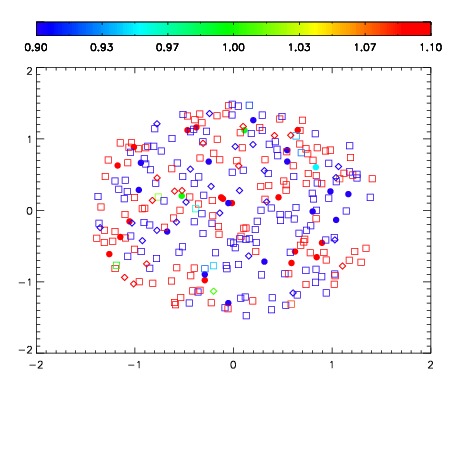
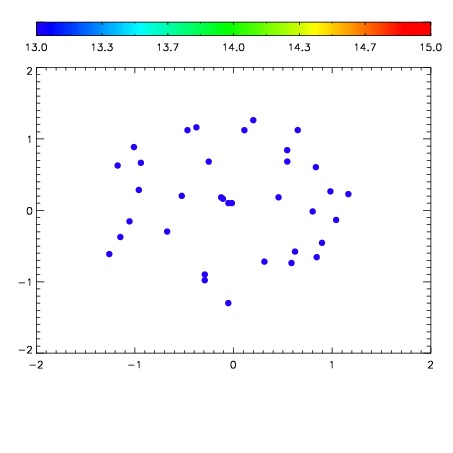

| Frame | Nreads | Zeropoints | Mag plots | Spatial mag deviation | Spatial sky 16325A emission deviations (filled: sky, open: star) | Spatial sky continuum emission | Spatial sky telluric CO2 absorption deviations (filled: H < 10) | |||||||||||||||||||||||
| 0 | 0 |
|
|
|
|
|
|
| IPAIR | NAME | SHIFT | NEWSHIFT | S/N | NAME | SHIFT | NEWSHIFT | S/N |
| 0 | 06640071 | 0.483108 | 0.00000 | 225.309 | 06640072 | -0.000795659 | 0.483904 | 226.490 |
| 1 | 06640070 | 0.482776 | 0.000332028 | 224.745 | 06640069 | 0.00000 | 0.483108 | 224.967 |
| 2 | 06640074 | 0.482265 | 0.000843018 | 224.537 | 06640073 | -0.00155557 | 0.484664 | 224.174 |
| 3 | 06640075 | 0.482506 | 0.000602007 | 221.822 | 06640076 | 0.00118510 | 0.481923 | 221.155 |