| Red | Green | Blue | |
| z | 17.64 | ||
| znorm | Inf | ||
| sky | -Inf | -Inf | -Inf |
| S/N | 27.4 | 48.2 | 51.7 |
| S/N(c) | 0.0 | 0.0 | 0.0 |
| SN(E/C) |
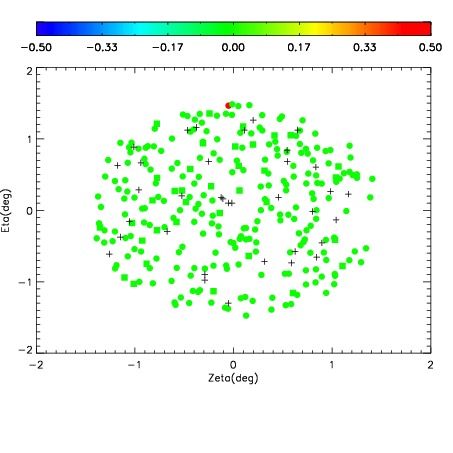

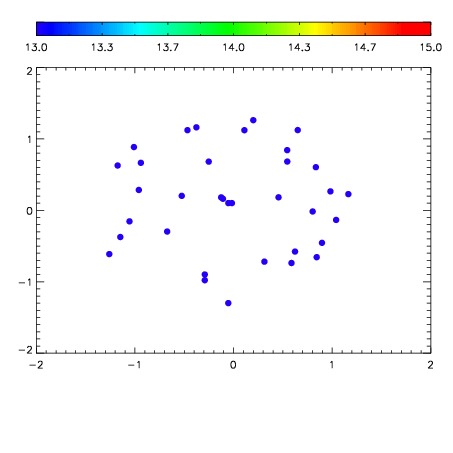

| Frame | Nreads | Zeropoints | Mag plots | Spatial mag deviation | Spatial sky 16325A emission deviations (filled: sky, open: star) | Spatial sky continuum emission | Spatial sky telluric CO2 absorption deviations (filled: H < 10) | |||||||||||||||||||||||
| 0 | 0 |
|
|
|
|
|
|
| IPAIR | NAME | SHIFT | NEWSHIFT | S/N | NAME | SHIFT | NEWSHIFT | S/N |
| 0 | 06680067 | 0.483757 | 0.00000 | 220.954 | 06680068 | 0.00242080 | 0.481336 | 221.647 |
| 1 | 06680070 | 0.483084 | 0.000672996 | 230.879 | 06680072 | -0.000134282 | 0.483891 | 233.770 |
| 2 | 06680066 | 0.483654 | 0.000102997 | 227.194 | 06680069 | 0.000552800 | 0.483204 | 229.066 |
| 3 | 06680071 | 0.483377 | 0.000379980 | 224.181 | 06680065 | 0.00000 | 0.483757 | 225.364 |