| Red | Green | Blue | |
| z | 17.64 | ||
| znorm | Inf | ||
| sky | -Inf | -Inf | -Inf |
| S/N | 28.4 | 49.3 | 52.4 |
| S/N(c) | 0.0 | 0.0 | 0.0 |
| SN(E/C) |
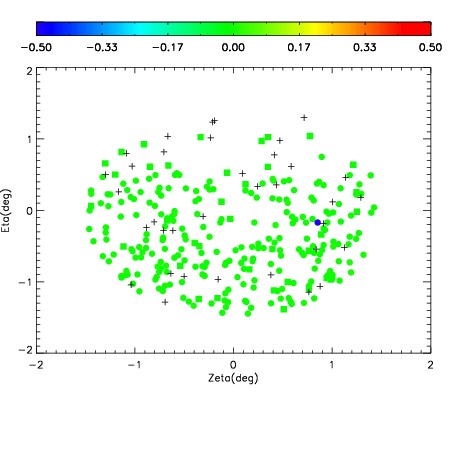
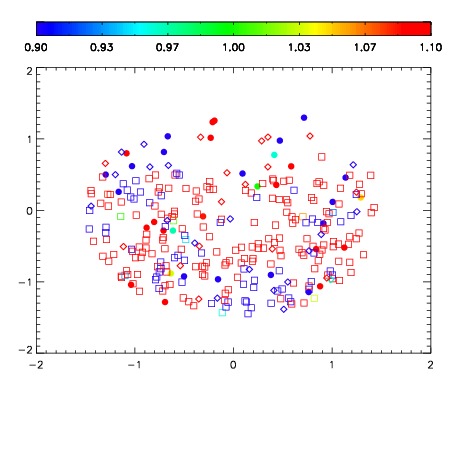
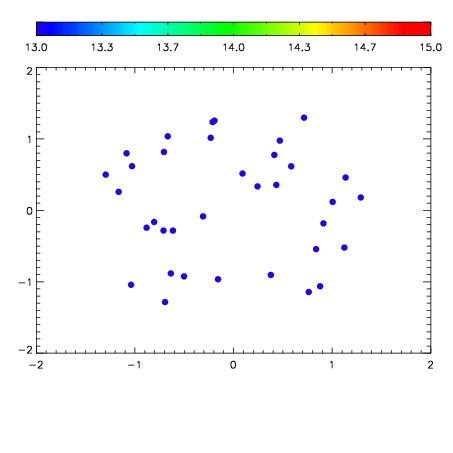

| Frame | Nreads | Zeropoints | Mag plots | Spatial mag deviation | Spatial sky 16325A emission deviations (filled: sky, open: star) | Spatial sky continuum emission | Spatial sky telluric CO2 absorption deviations (filled: H < 10) | |||||||||||||||||||||||
| 0 | 0 |
|
|
|
|
|
|
| IPAIR | NAME | SHIFT | NEWSHIFT | S/N | NAME | SHIFT | NEWSHIFT | S/N |
| 0 | 06960063 | 0.490252 | 0.00000 | 241.344 | 06960064 | 0.000409362 | 0.489843 | 239.198 |
| 1 | 06960062 | 0.489180 | 0.00107199 | 241.935 | 06960061 | 0.00178476 | 0.488467 | 241.257 |
| 2 | 06960059 | 0.488379 | 0.00187299 | 240.491 | 06960060 | 0.000796782 | 0.489455 | 239.132 |
| 3 | 06960058 | 0.488044 | 0.00220799 | 239.020 | 06960057 | 0.00000 | 0.490252 | 233.559 |