| Red | Green | Blue | |
| z | 17.64 | ||
| znorm | Inf | ||
| sky | -Inf | -Inf | -Inf |
| S/N | 25.0 | 42.8 | 49.7 |
| S/N(c) | 0.0 | 0.0 | 0.0 |
| SN(E/C) |

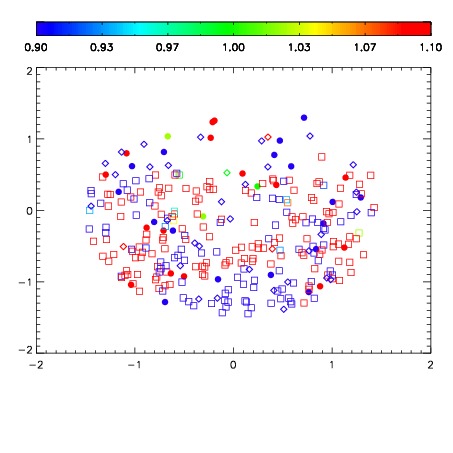
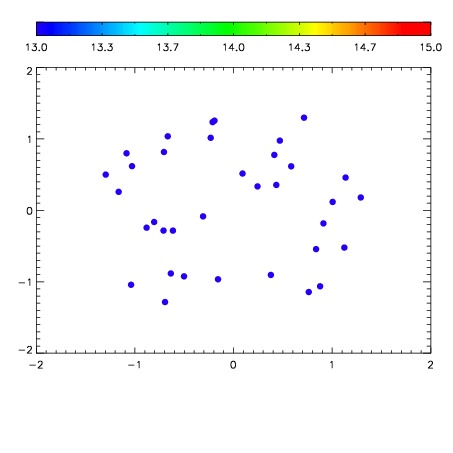

| Frame | Nreads | Zeropoints | Mag plots | Spatial mag deviation | Spatial sky 16325A emission deviations (filled: sky, open: star) | Spatial sky continuum emission | Spatial sky telluric CO2 absorption deviations (filled: H < 10) | |||||||||||||||||||||||
| 0 | 0 |
|
|
|
|
|
|
| IPAIR | NAME | SHIFT | NEWSHIFT | S/N | NAME | SHIFT | NEWSHIFT | S/N |
| 0 | 07030066 | 0.474972 | 0.00000 | 215.055 | 07030067 | 0.00200518 | 0.472967 | 212.591 |
| 1 | 07030062 | 0.472993 | 0.00197902 | 229.428 | 07030064 | 0.00287556 | 0.472096 | 227.207 |
| 2 | 07030061 | 0.473280 | 0.00169200 | 228.970 | 07030063 | 0.000879009 | 0.474093 | 222.819 |
| 3 | 07030065 | 0.473755 | 0.00121701 | 222.592 | 07030060 | 0.00000 | 0.474972 | 220.955 |