| Red | Green | Blue | |
| z | 17.64 | ||
| znorm | Inf | ||
| sky | -Inf | -Inf | -Inf |
| S/N | 33.1 | 56.3 | 62.8 |
| S/N(c) | 0.0 | 0.0 | 0.0 |
| SN(E/C) |
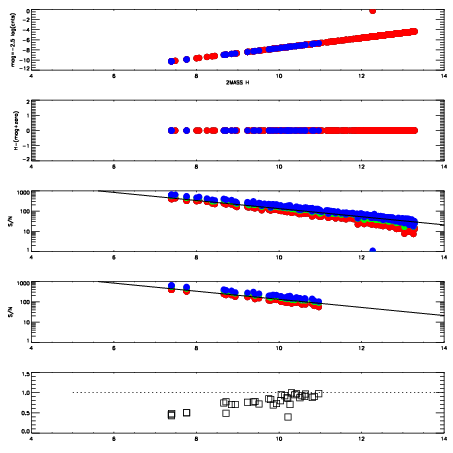
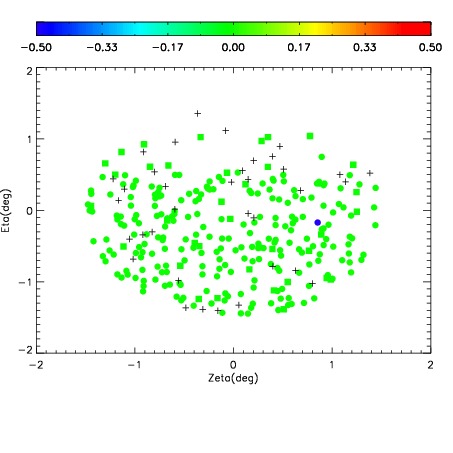
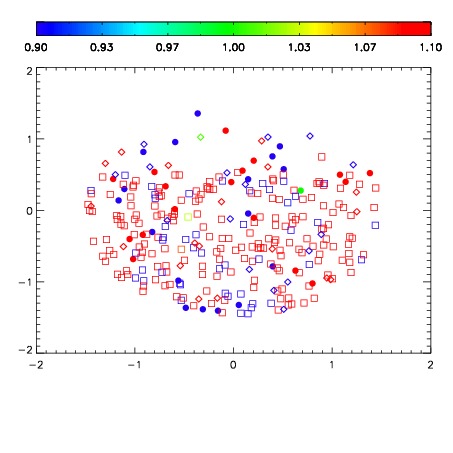
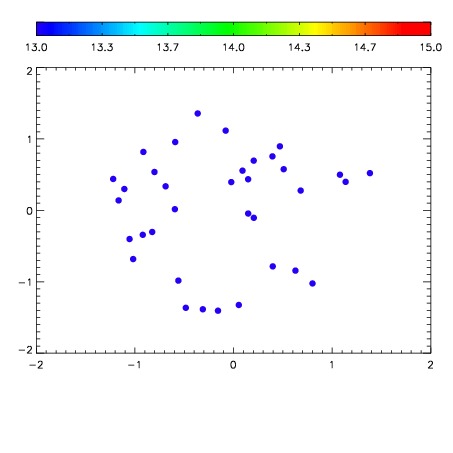

| Frame | Nreads | Zeropoints | Mag plots | Spatial mag deviation | Spatial sky 16325A emission deviations (filled: sky, open: star) | Spatial sky continuum emission | Spatial sky telluric CO2 absorption deviations (filled: H < 10) | |||||||||||||||||||||||
| 0 | 0 |
|
|
|
|
|
|
| IPAIR | NAME | SHIFT | NEWSHIFT | S/N | NAME | SHIFT | NEWSHIFT | S/N |
| 0 | 06970085 | 0.491240 | 0.00000 | 210.181 | 06970086 | 0.000348432 | 0.490892 | 210.048 |
| 1 | 06970089 | 0.490735 | 0.000505000 | 214.944 | 06970091 | -0.000784765 | 0.492025 | 219.535 |
| 2 | 06970088 | 0.489963 | 0.00127700 | 214.345 | 06970090 | 0.000429598 | 0.490810 | 215.037 |
| 3 | 06970092 | 0.487301 | 0.00393900 | 213.966 | 06970087 | 9.17978e-07 | 0.491239 | 210.875 |
| 4 | 06970084 | 0.489451 | 0.00178900 | 207.532 | 06970083 | 0.00000 | 0.491240 | 201.173 |