| Red | Green | Blue | |
| z | 17.64 | ||
| znorm | Inf | ||
| sky | -Inf | -Inf | -Inf |
| S/N | 17.9 | 33.8 | 38.6 |
| S/N(c) | 0.0 | 0.0 | 0.0 |
| SN(E/C) |
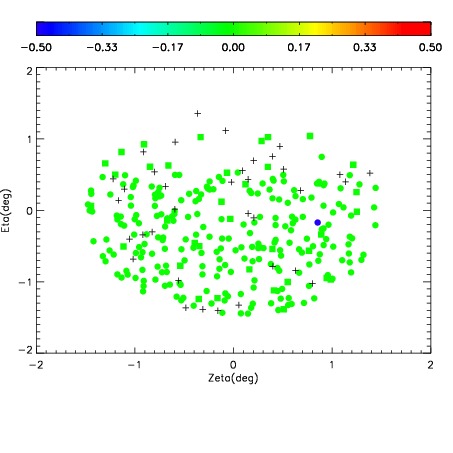
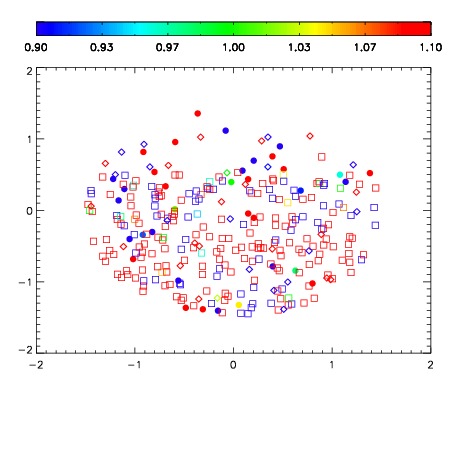
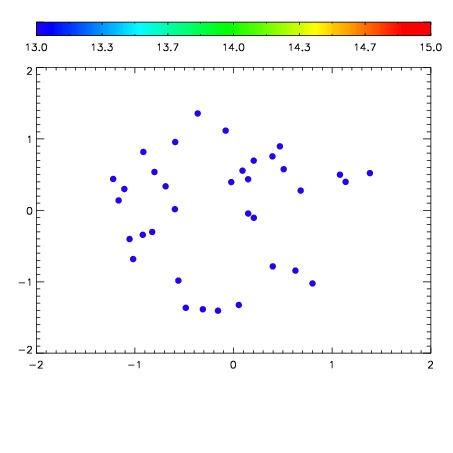

| Frame | Nreads | Zeropoints | Mag plots | Spatial mag deviation | Spatial sky 16325A emission deviations (filled: sky, open: star) | Spatial sky continuum emission | Spatial sky telluric CO2 absorption deviations (filled: H < 10) | |||||||||||||||||||||||
| 0 | 0 |
|
|
|
|
|
|
| IPAIR | NAME | SHIFT | NEWSHIFT | S/N | NAME | SHIFT | NEWSHIFT | S/N |
| 0 | 07040053 | 0.473176 | 0.00000 | 120.769 | 07040052 | 0.00228063 | 0.470895 | 125.722 |
| 1 | 07040050 | 0.472474 | 0.000701994 | 132.572 | 07040048 | 0.00000 | 0.473176 | 143.485 |
| 2 | 07040049 | 0.471311 | 0.00186500 | 128.626 | 07040051 | 0.00279057 | 0.470385 | 134.776 |
| 3 | 07040054 | 0.472961 | 0.000214994 | 113.986 | 07040055 | 0.00618873 | 0.466987 | 116.191 |