| Red | Green | Blue | |
| z | 17.64 | ||
| znorm | Inf | ||
| sky | -NaN | -Inf | -Inf |
| S/N | 23.2 | 41.9 | 45.7 |
| S/N(c) | 0.0 | 0.0 | 0.0 |
| SN(E/C) |
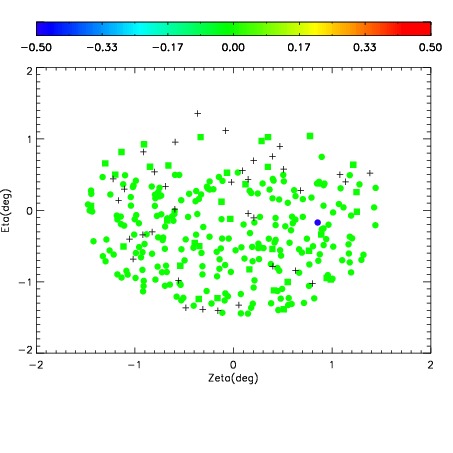
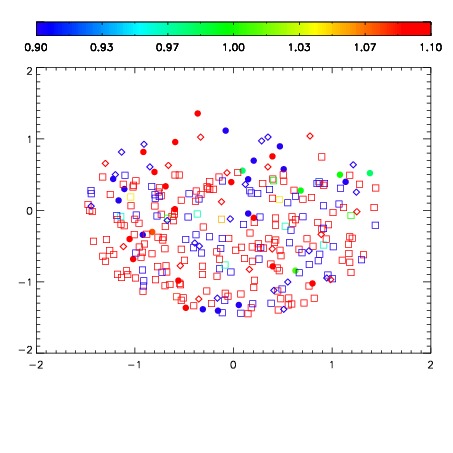
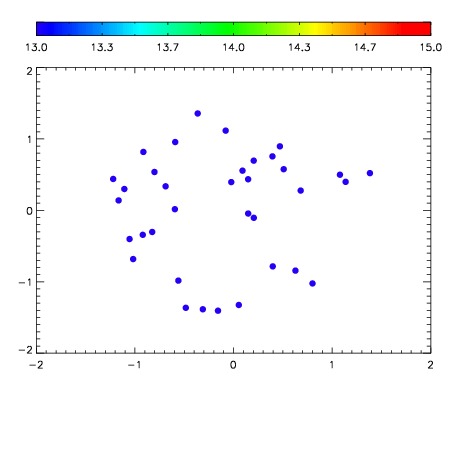

| Frame | Nreads | Zeropoints | Mag plots | Spatial mag deviation | Spatial sky 16325A emission deviations (filled: sky, open: star) | Spatial sky continuum emission | Spatial sky telluric CO2 absorption deviations (filled: H < 10) | |||||||||||||||||||||||
| 0 | 0 |
|
|
|
|
|
|
| IPAIR | NAME | SHIFT | NEWSHIFT | S/N | NAME | SHIFT | NEWSHIFT | S/N |
| 0 | 07510064 | 0.471015 | 0.00000 | 166.148 | 07510069 | -0.00571257 | 0.476728 | 161.626 |
| 1 | 07510063 | 0.469694 | 0.00132102 | 174.103 | 07510062 | 0.00000 | 0.471015 | 169.841 |
| 2 | 07510068 | 0.470030 | 0.000984997 | 159.579 | 07510065 | -0.000824612 | 0.471840 | 158.804 |
| 3 | 07510067 | 0.469515 | 0.00150001 | 149.944 | 07510066 | -0.00487195 | 0.475887 | 156.311 |