| Red | Green | Blue | |
| z | 17.64 | ||
| znorm | Inf | ||
| sky | -Inf | -Inf | -Inf |
| S/N | 25.9 | 43.8 | 49.9 |
| S/N(c) | 0.0 | 0.0 | 0.0 |
| SN(E/C) |
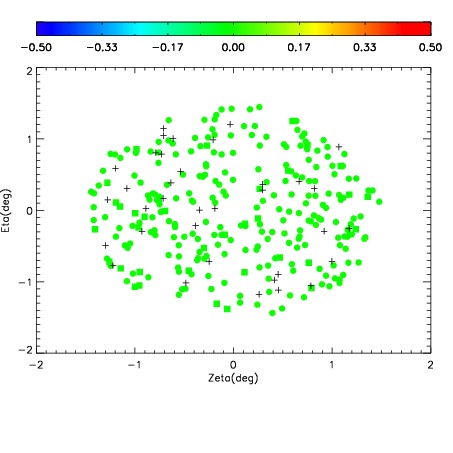
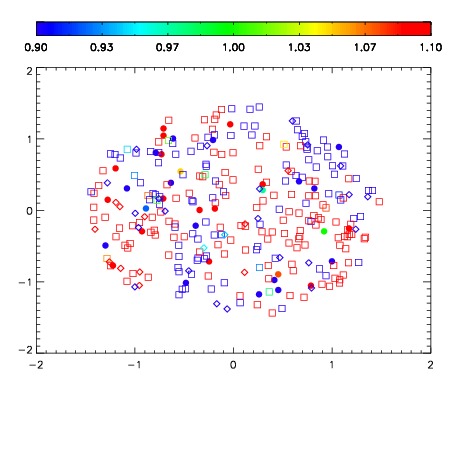
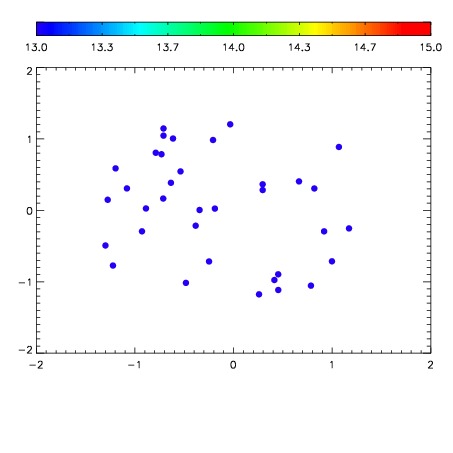

| Frame | Nreads | Zeropoints | Mag plots | Spatial mag deviation | Spatial sky 16325A emission deviations (filled: sky, open: star) | Spatial sky continuum emission | Spatial sky telluric CO2 absorption deviations (filled: H < 10) | |||||||||||||||||||||||
| 0 | 0 |
|
|
|
|
|
|
| IPAIR | NAME | SHIFT | NEWSHIFT | S/N | NAME | SHIFT | NEWSHIFT | S/N |
| 0 | 06460028 | 0.471258 | 0.00000 | 197.400 | 06460029 | 0.00101671 | 0.470241 | 204.342 |
| 1 | 06460027 | 0.470541 | 0.000717014 | 175.158 | 06460026 | 0.000719997 | 0.470538 | 175.823 |
| 2 | 06460023 | 0.470250 | 0.00100800 | 166.867 | 06460025 | 0.00189392 | 0.469364 | 175.657 |
| 3 | 06460024 | 0.470712 | 0.000546008 | 165.443 | 06460022 | 0.00000 | 0.471258 | 154.360 |