| Red | Green | Blue | |
| z | 17.64 | ||
| znorm | Inf | ||
| sky | -Inf | -Inf | -Inf |
| S/N | 29.8 | 46.9 | 56.8 |
| S/N(c) | 0.0 | 0.0 | 0.0 |
| SN(E/C) |
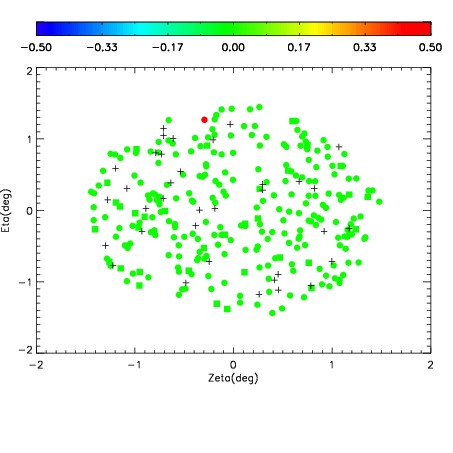
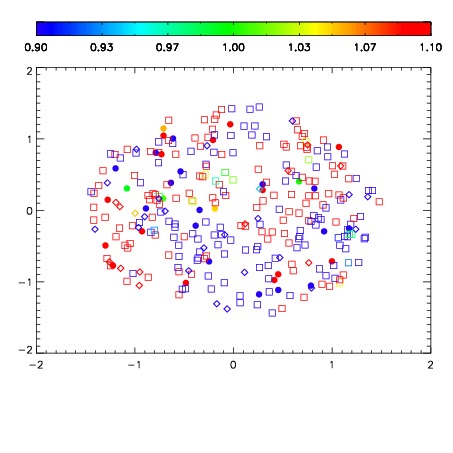
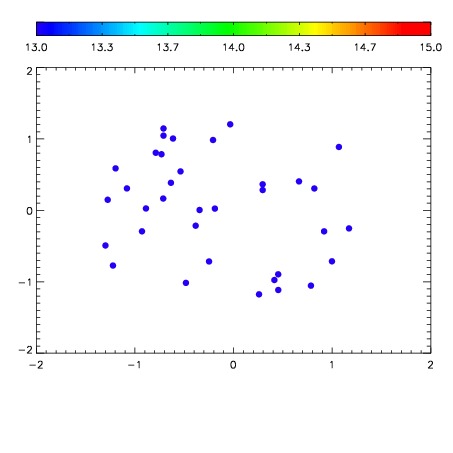

| Frame | Nreads | Zeropoints | Mag plots | Spatial mag deviation | Spatial sky 16325A emission deviations (filled: sky, open: star) | Spatial sky continuum emission | Spatial sky telluric CO2 absorption deviations (filled: H < 10) | |||||||||||||||||||||||
| 0 | 0 |
|
|
|
|
|
|
| IPAIR | NAME | SHIFT | NEWSHIFT | S/N | NAME | SHIFT | NEWSHIFT | S/N |
| 0 | 06660083 | 0.483635 | 0.00000 | 197.471 | 06660082 | 0.00156618 | 0.482069 | 197.097 |
| 1 | 06660084 | 0.483020 | 0.000615001 | 206.331 | 06660085 | 0.00367084 | 0.479964 | 203.850 |
| 2 | 06660080 | 0.482910 | 0.000725001 | 202.558 | 06660081 | 0.00591950 | 0.477716 | 202.881 |
| 3 | 06660079 | 0.483000 | 0.000634998 | 196.106 | 06660078 | 0.00000 | 0.483635 | 192.955 |