| Red | Green | Blue | |
| z | 17.64 | ||
| znorm | Inf | ||
| sky | -Inf | -Inf | -Inf |
| S/N | 26.7 | 45.3 | 52.0 |
| S/N(c) | 0.0 | 0.0 | 0.0 |
| SN(E/C) |
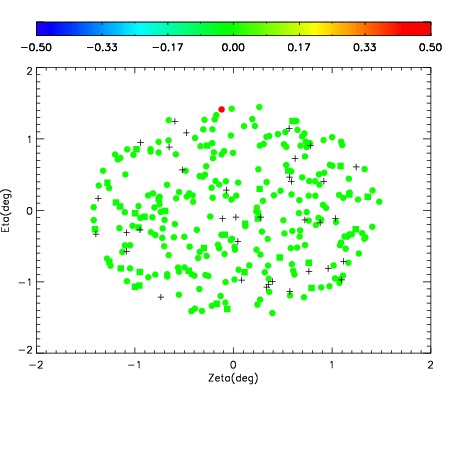
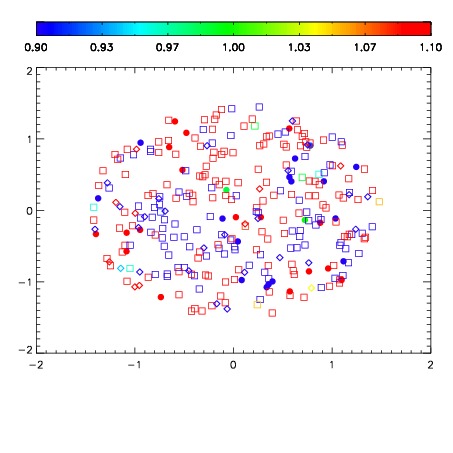
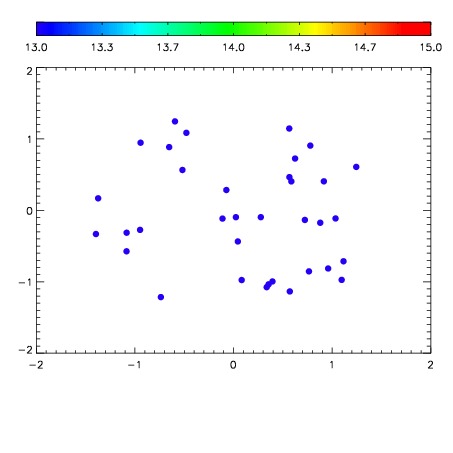

| Frame | Nreads | Zeropoints | Mag plots | Spatial mag deviation | Spatial sky 16325A emission deviations (filled: sky, open: star) | Spatial sky continuum emission | Spatial sky telluric CO2 absorption deviations (filled: H < 10) | |||||||||||||||||||||||
| 0 | 0 |
|
|
|
|
|
|
| IPAIR | NAME | SHIFT | NEWSHIFT | S/N | NAME | SHIFT | NEWSHIFT | S/N |
| 0 | 06410096 | 0.472422 | 0.00000 | 167.997 | 06410090 | 0.00000 | 0.472422 | 169.109 |
| 1 | 06410091 | 0.470652 | 0.00176999 | 167.903 | 06410097 | -0.00386081 | 0.476283 | 167.791 |
| 2 | 06410092 | 0.470971 | 0.00145102 | 162.292 | 06410093 | 0.00213877 | 0.470283 | 163.879 |
| 3 | 06410095 | 0.471998 | 0.000423998 | 161.684 | 06410094 | 0.00295264 | 0.469469 | 152.553 |