| Red | Green | Blue | |
| z | 17.64 | ||
| znorm | Inf | ||
| sky | -Inf | -Inf | -Inf |
| S/N | 27.4 | 44.5 | 57.7 |
| S/N(c) | 0.0 | 0.0 | 0.0 |
| SN(E/C) |
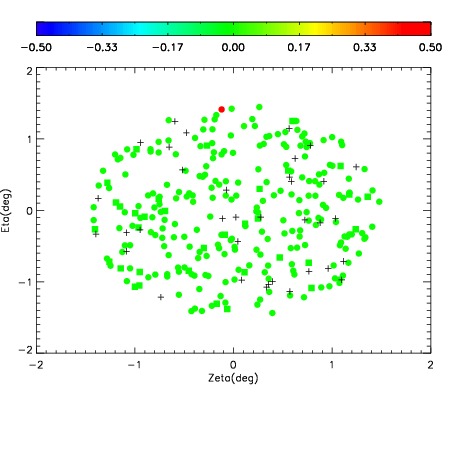

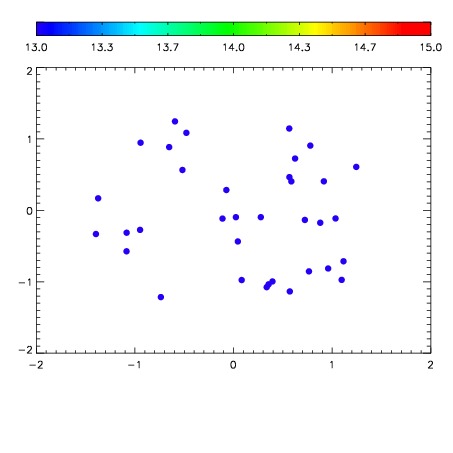

| Frame | Nreads | Zeropoints | Mag plots | Spatial mag deviation | Spatial sky 16325A emission deviations (filled: sky, open: star) | Spatial sky continuum emission | Spatial sky telluric CO2 absorption deviations (filled: H < 10) | |||||||||||||||||||||||
| 0 | 0 |
|
|
|
|
|
|
| IPAIR | NAME | SHIFT | NEWSHIFT | S/N | NAME | SHIFT | NEWSHIFT | S/N |
| 0 | 06640086 | 0.485460 | 0.00000 | 170.380 | 06640087 | 0.00116813 | 0.484292 | 171.725 |
| 1 | 06640085 | 0.485106 | 0.000354022 | 170.059 | 06640084 | -0.000255982 | 0.485716 | 167.891 |
| 2 | 06640082 | 0.484670 | 0.000790000 | 161.768 | 06640080 | 0.00000 | 0.485460 | 163.625 |
| 3 | 06640081 | 0.484177 | 0.00128302 | 161.146 | 06640083 | 0.00277386 | 0.482686 | 163.538 |