| Red | Green | Blue | |
| z | 17.64 | ||
| znorm | Inf | ||
| sky | -Inf | -Inf | -Inf |
| S/N | 27.3 | 44.4 | 56.2 |
| S/N(c) | 0.0 | 0.0 | 0.0 |
| SN(E/C) |
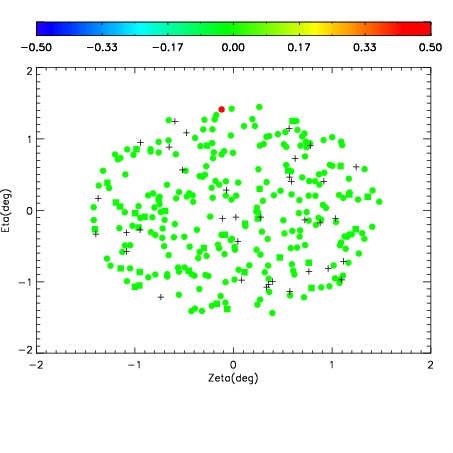
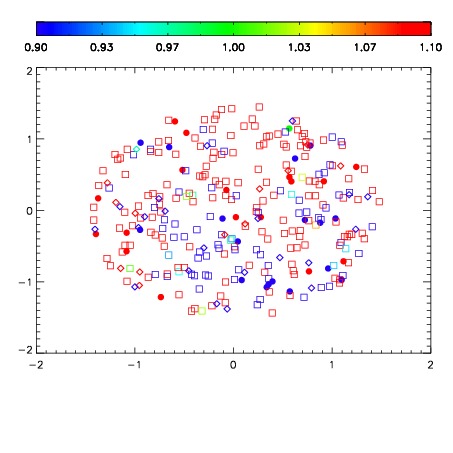
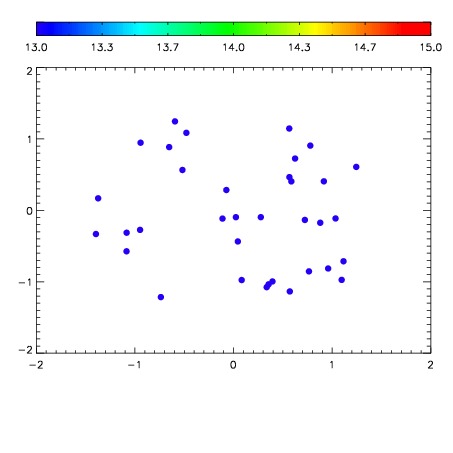

| Frame | Nreads | Zeropoints | Mag plots | Spatial mag deviation | Spatial sky 16325A emission deviations (filled: sky, open: star) | Spatial sky continuum emission | Spatial sky telluric CO2 absorption deviations (filled: H < 10) | |||||||||||||||||||||||
| 0 | 0 |
|
|
|
|
|
|
| IPAIR | NAME | SHIFT | NEWSHIFT | S/N | NAME | SHIFT | NEWSHIFT | S/N |
| 0 | 06680078 | 0.486250 | 0.00000 | 161.778 | 06680079 | 0.000631782 | 0.485618 | 161.885 |
| 1 | 06680081 | 0.485744 | 0.000506014 | 169.181 | 06680083 | 0.00165429 | 0.484596 | 170.034 |
| 2 | 06680082 | 0.486158 | 9.19998e-05 | 167.364 | 06680080 | -0.00137263 | 0.487623 | 166.653 |
| 3 | 06680077 | 0.486139 | 0.000111014 | 164.022 | 06680076 | 0.00000 | 0.486250 | 163.311 |