| Red | Green | Blue | |
| z | 17.64 | ||
| znorm | Inf | ||
| sky | -NaN | -NaN | -Inf |
| S/N | 34.3 | 60.6 | 67.4 |
| S/N(c) | 0.0 | 0.0 | 0.0 |
| SN(E/C) |
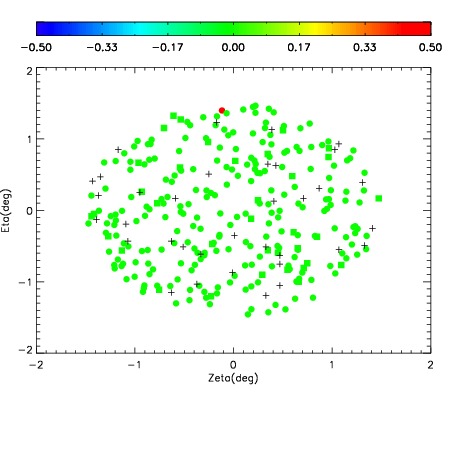
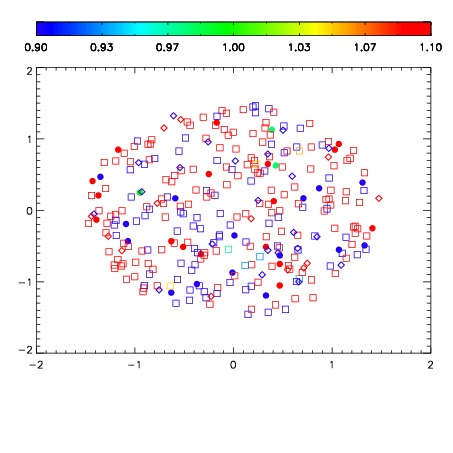
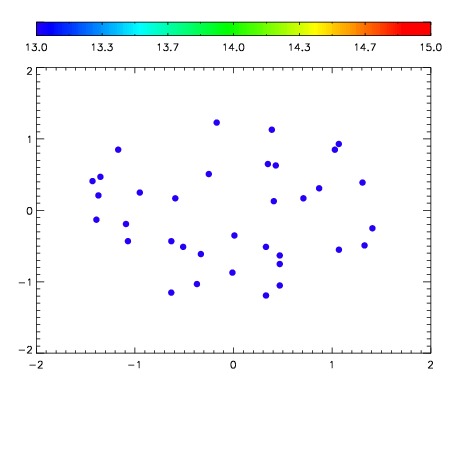

| Frame | Nreads | Zeropoints | Mag plots | Spatial mag deviation | Spatial sky 16325A emission deviations (filled: sky, open: star) | Spatial sky continuum emission | Spatial sky telluric CO2 absorption deviations (filled: H < 10) | |||||||||||||||||||||||
| 0 | 0 |
|
|
|
|
|
|
| IPAIR | NAME | SHIFT | NEWSHIFT | S/N | NAME | SHIFT | NEWSHIFT | S/N |
| 0 | 07500074 | 0.484213 | 0.00000 | 249.323 | 07500068 | -0.000485404 | 0.484698 | 241.746 |
| 1 | 07500073 | 0.483181 | 0.00103199 | 250.395 | 07500072 | 0.00456871 | 0.479644 | 250.255 |
| 2 | 07500069 | 0.477287 | 0.00692600 | 249.880 | 07500075 | 0.00456358 | 0.479649 | 249.361 |
| 3 | 07500070 | 0.480222 | 0.00399101 | 249.405 | 07500071 | 0.00272500 | 0.481488 | 248.708 |
| 4 | 07500066 | 0.478779 | 0.00543401 | 246.902 | 07500067 | 0.000850603 | 0.483362 | 241.679 |
| 5 | 07500065 | 0.478972 | 0.00524101 | 243.497 | 07500064 | 0.00000 | 0.484213 | 220.934 |