| Red | Green | Blue | |
| z | 17.64 | ||
| znorm | Inf | ||
| sky | -Inf | -Inf | -Inf |
| S/N | 33.0 | 55.4 | 65.2 |
| S/N(c) | 0.0 | 0.0 | 0.0 |
| SN(E/C) |
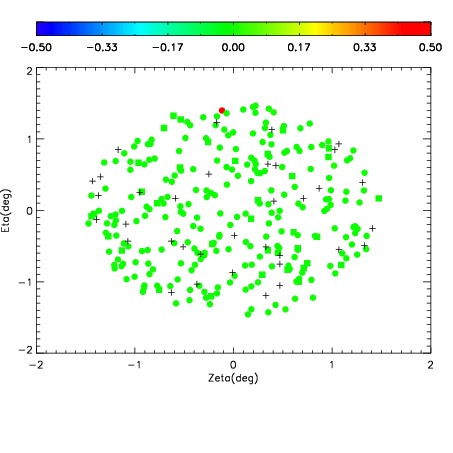
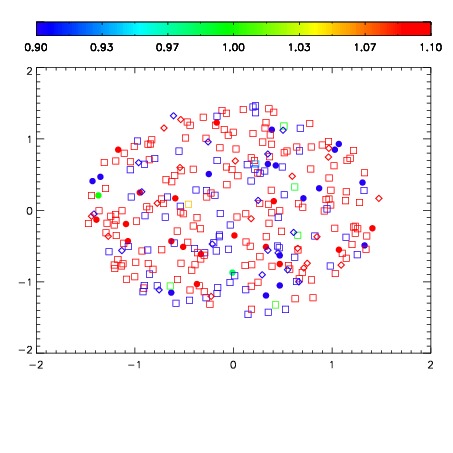
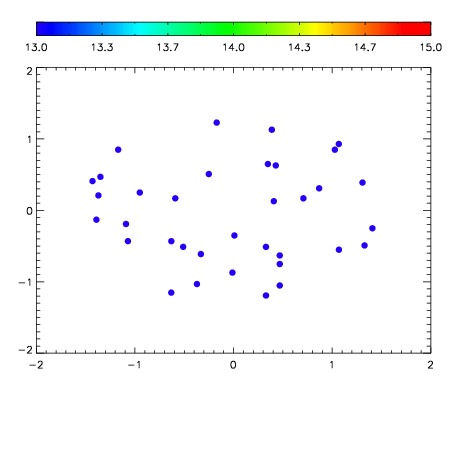

| Frame | Nreads | Zeropoints | Mag plots | Spatial mag deviation | Spatial sky 16325A emission deviations (filled: sky, open: star) | Spatial sky continuum emission | Spatial sky telluric CO2 absorption deviations (filled: H < 10) | |||||||||||||||||||||||
| 0 | 0 |
|
|
|
|
|
|
| IPAIR | NAME | SHIFT | NEWSHIFT | S/N | NAME | SHIFT | NEWSHIFT | S/N |
| 0 | 07870035 | 0.469429 | 0.00000 | 131.977 | 07870036 | 0.000992265 | 0.468437 | 126.419 |
| 1 | 07870034 | 0.469069 | 0.000359982 | 221.602 | 07870033 | 0.000316265 | 0.469113 | 218.971 |
| 2 | 07870031 | 0.469067 | 0.000361979 | 208.988 | 07870025 | 0.00000 | 0.469429 | 206.608 |
| 3 | 07870030 | 0.468800 | 0.000628978 | 206.858 | 07870032 | 0.000314979 | 0.469114 | 205.715 |
| 4 | 07870026 | 0.468545 | 0.000883996 | 205.342 | 07870029 | -3.78047e-05 | 0.469467 | 203.476 |
| 5 | 07870027 | 0.469075 | 0.000353992 | 205.263 | 07870028 | 0.000815367 | 0.468614 | 200.910 |
| 6 | 07870038 | 0.467159 | 0.00226998 | 144.416 | 07870037 | 0.00200661 | 0.467422 | 152.821 |