| Red | Green | Blue | |
| z | 17.64 | ||
| znorm | Inf | ||
| sky | -Inf | -Inf | -Inf |
| S/N | 29.3 | 46.8 | 61.9 |
| S/N(c) | 0.0 | 0.0 | 0.0 |
| SN(E/C) |
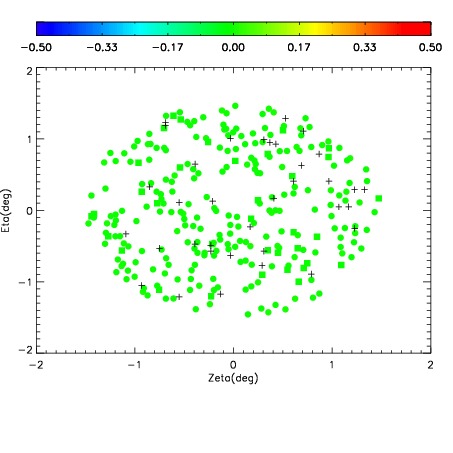
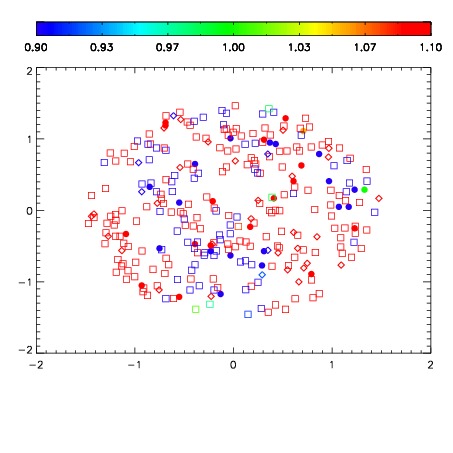
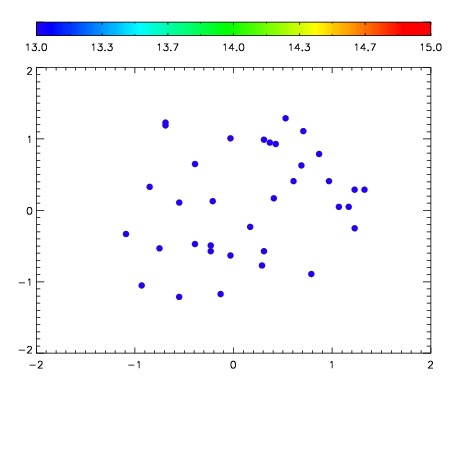

| Frame | Nreads | Zeropoints | Mag plots | Spatial mag deviation | Spatial sky 16325A emission deviations (filled: sky, open: star) | Spatial sky continuum emission | Spatial sky telluric CO2 absorption deviations (filled: H < 10) | |||||||||||||||||||||||
| 0 | 0 |
|
|
|
|
|
|
| IPAIR | NAME | SHIFT | NEWSHIFT | S/N | NAME | SHIFT | NEWSHIFT | S/N |
| 0 | 07510057 | 0.470083 | 0.00000 | 149.552 | 07510050 | 0.00400759 | 0.466075 | 148.124 |
| 1 | 07510056 | 0.469629 | 0.000454009 | 151.905 | 07510051 | 0.000487167 | 0.469596 | 148.400 |
| 2 | 07510048 | 0.468057 | 0.00202599 | 151.208 | 07510055 | 0.000279739 | 0.469803 | 148.240 |
| 3 | 07510049 | 0.468660 | 0.00142300 | 149.422 | 07510047 | 0.00000 | 0.470083 | 147.945 |
| 4 | 07510052 | 0.469240 | 0.000842988 | 146.384 | 07510058 | 0.000452981 | 0.469630 | 147.622 |
| 5 | 07510053 | 0.469425 | 0.000658005 | 145.883 | 07510054 | 0.00137362 | 0.468709 | 146.446 |