| Frame | Nreads | Zeropoints | Mag plots
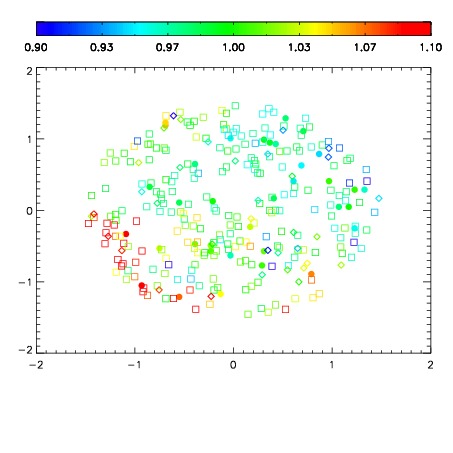
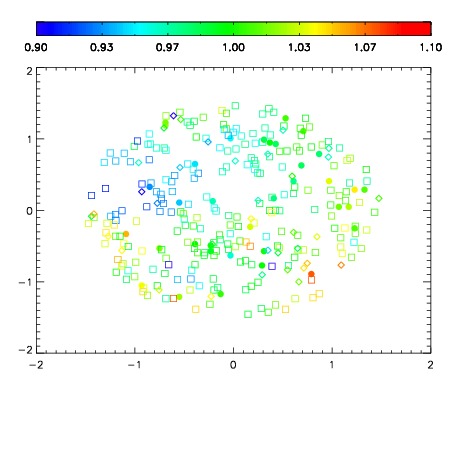
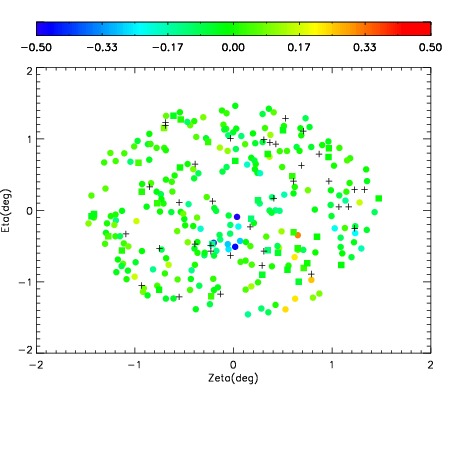
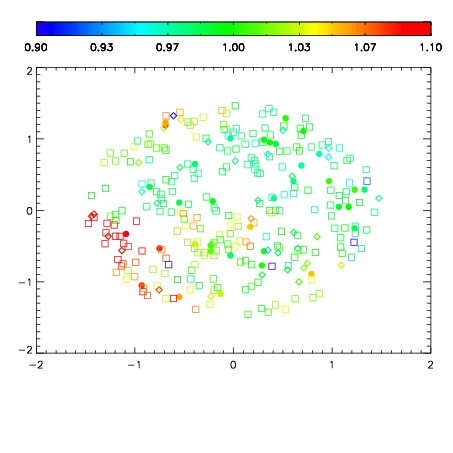
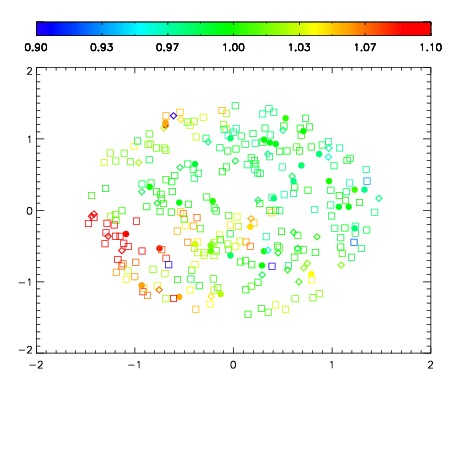
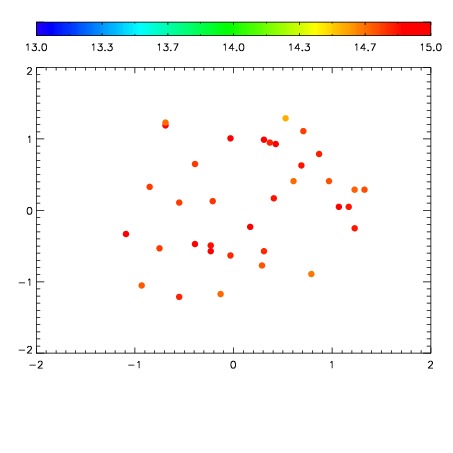
| Spatial mag deviation
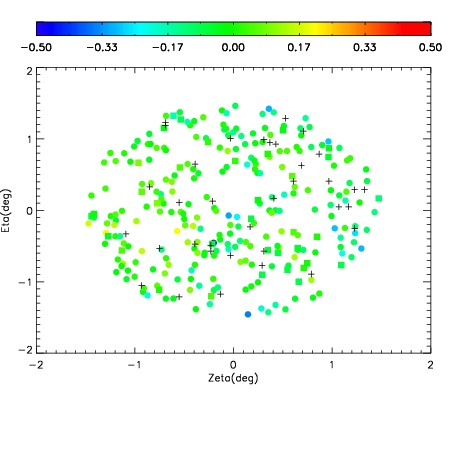
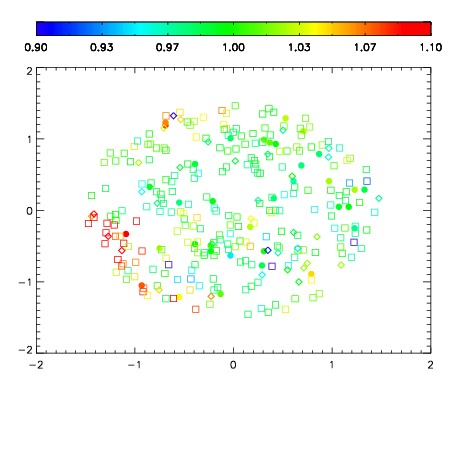
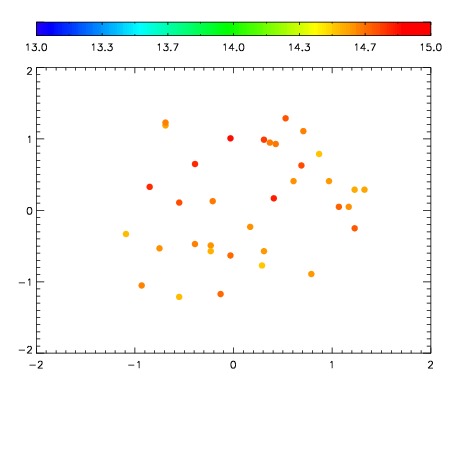
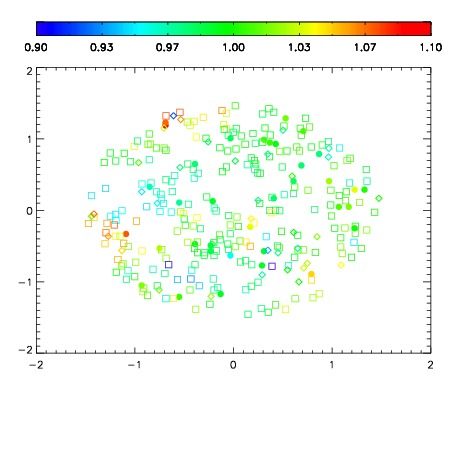
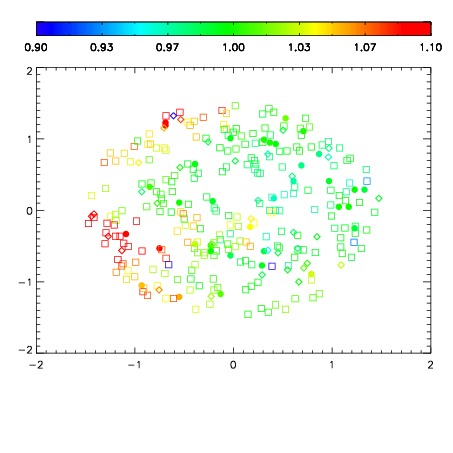
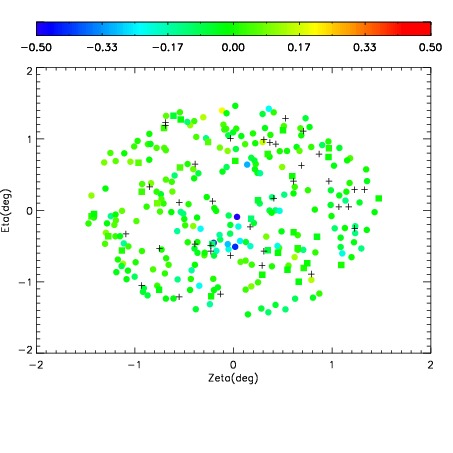
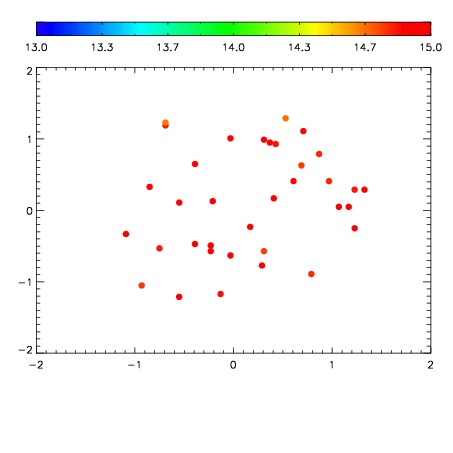
| Spatial sky 16325A emission deviations (filled: sky, open: star)
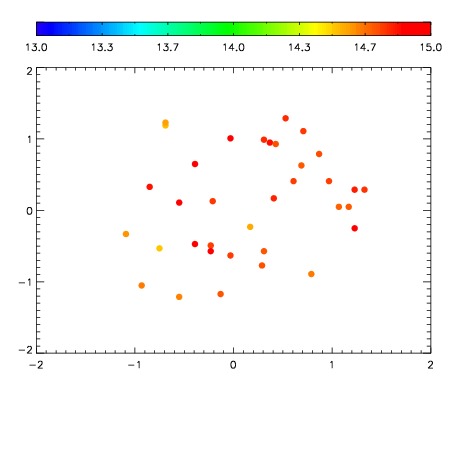
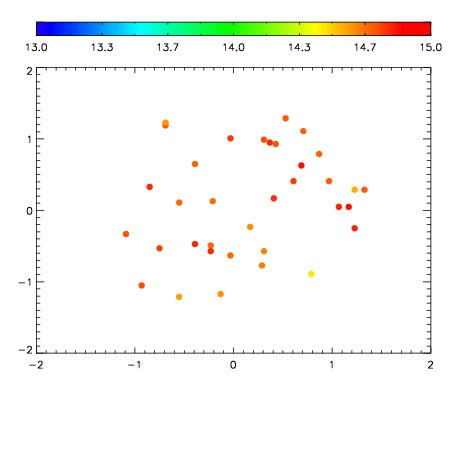
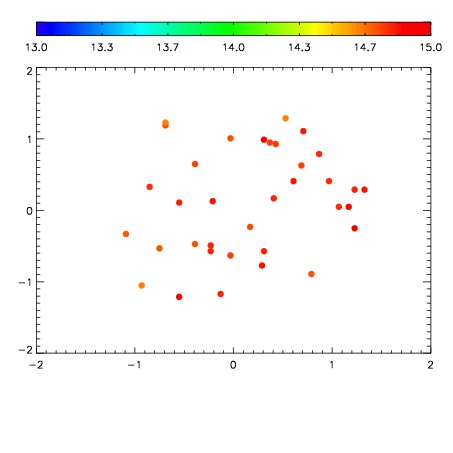
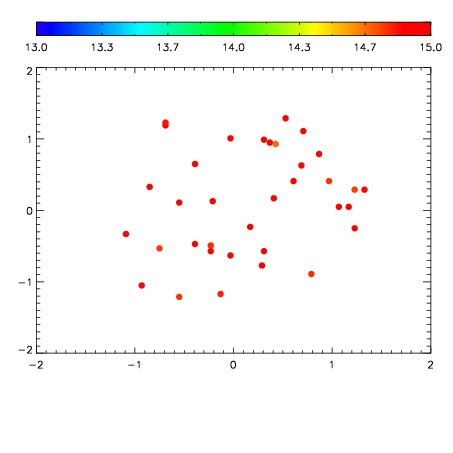
| Spatial sky continuum emission
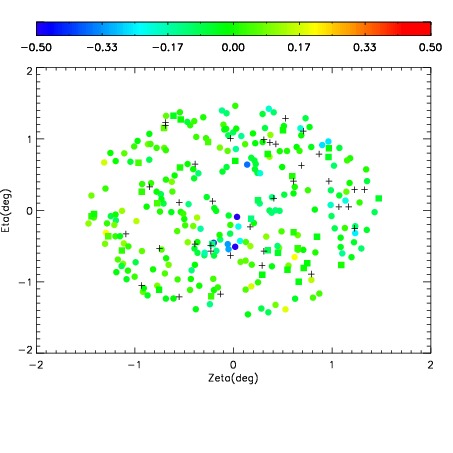
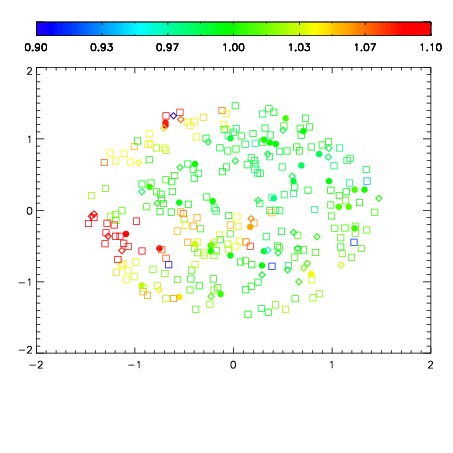
| Spatial sky telluric CO2 absorption deviations (filled: H < 10)
|
| 7880026
| 47
| | Red | Green | Blue
| | z | | 17.95
| | znorm | | 13.76
| | sky | 15.4 | 14.8 | 14.5
| | S/N | 7.5 | 13.4 | 13.6
| | S/N(c) | 6.4 | 12.0 | 12.9
| | SN(E/C) 0.96
|
| 
| 
| 
| 
| 
|
| 7880027
| 47
| | Red | Green | Blue
| | z | | 17.69
| | znorm | | 13.51
| | sky | 15.0 | 14.7 | 15.2
| | S/N | 6.0 | 11.2 | 11.5
| | S/N(c) | 5.1 | 10.1 | 10.7
| | SN(E/C) 1.00
|
| 
| 
| 
| 
| 
|
| 7880028
| 47
| | Red | Green | Blue
| | z | | 17.25
| | znorm | | 13.07
| | sky | 14.9 | 14.6 | 14.8
| | S/N | 4.0 | 8.3 | 8.2
| | S/N(c) | 3.5 | 7.8 | 7.7
| | SN(E/C) 1.00
|
| 
| 
| 
| 
| 
|
| 7880029
| 47
| | Red | Green | Blue
| | z | | 17.00
| | znorm | | 12.82
| | sky | 15.1 | 14.7 | 14.8
| | S/N | 3.1 | 7.0 | 6.4
| | S/N(c) | 2.7 | 6.4 | 6.0
| | SN(E/C) 1.01
|
| 
| 
| 
| 
| 
|
| 7880030
| 47
| | Red | Green | Blue
| | z | | 17.47
| | znorm | | 13.29
| | sky | 15.3 | 14.8 | 14.7
| | S/N | 4.8 | 9.8 | 9.5
| | S/N(c) | 4.1 | 8.6 | 8.9
| | SN(E/C) 0.95
|
| 
| 
| 
| 
| 
|
| 7880031
| 47
| | Red | Green | Blue
| | z | | 16.95
| | znorm | | 12.77
| | sky | 15.1 | 14.9 | 14.8
| | S/N | 3.0 | 6.9 | 6.7
| | S/N(c) | 2.6 | 6.2 | 6.3
| | SN(E/C) 1.01
|
| 
| 
| 
| 
| 
|
| 7880032
| 47
| | Red | Green | Blue
| | z | | 16.98
| | znorm | | 12.80
| | sky | 15.2 | 14.8 | 15.0
| | S/N | 3.2 | 7.1 | 6.8
| | S/N(c) | 2.8 | 6.3 | 6.3
| | SN(E/C) 0.97
|
| 
| 
| 
| 
| 
|
| 7880033
| 47
| | Red | Green | Blue
| | z | | 17.03
| | znorm | | 12.85
| | sky | 15.2 | 14.9 | 14.9
| | S/N | 3.4 | 7.3 | 7.0
| | S/N(c) | 2.9 | 6.5 | 6.6
| | SN(E/C) 0.98
|
| 
| 
| 
| 
| 
|