| Red | Green | Blue | |
| z | 17.64 | ||
| znorm | Inf | ||
| sky | -Inf | -Inf | -Inf |
| S/N | 7.8 | 16.3 | 16.7 |
| S/N(c) | 0.0 | 0.0 | 0.0 |
| SN(E/C) |
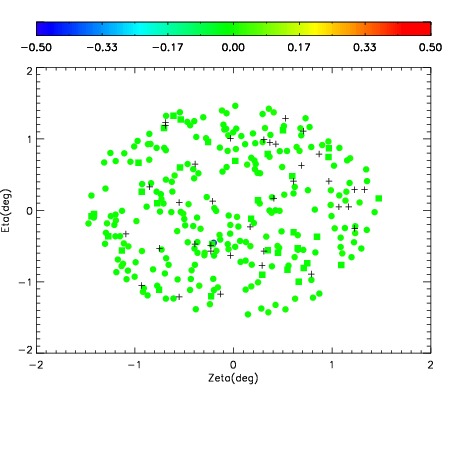
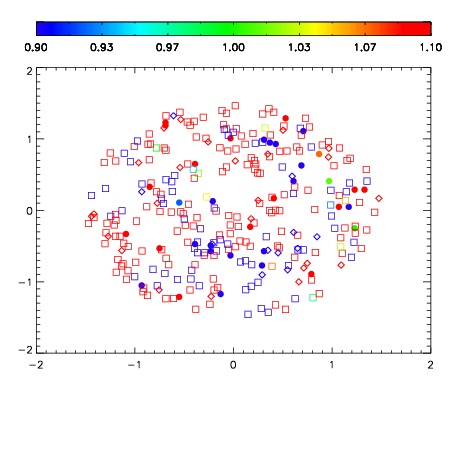
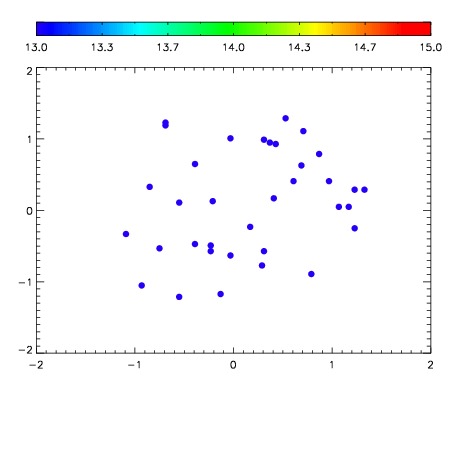

| Frame | Nreads | Zeropoints | Mag plots | Spatial mag deviation | Spatial sky 16325A emission deviations (filled: sky, open: star) | Spatial sky continuum emission | Spatial sky telluric CO2 absorption deviations (filled: H < 10) | |||||||||||||||||||||||
| 0 | 0 |
|
|
|
|
|
|
| IPAIR | NAME | SHIFT | NEWSHIFT | S/N | NAME | SHIFT | NEWSHIFT | S/N |
| 0 | 07880032 | 0.473205 | 0.00000 | 81.8997 | 07880033 | 0.00235339 | 0.470852 | 82.7682 |
| 1 | 07880027 | 0.469713 | 0.00349200 | 111.765 | 07880026 | 0.00000 | 0.473205 | 126.109 |
| 2 | 07880028 | 0.470546 | 0.00265899 | 93.0726 | 07880030 | -0.00113473 | 0.474340 | 99.4394 |
| 3 | 07880031 | 0.472229 | 0.000975996 | 78.6060 | 07880029 | -0.000297498 | 0.473502 | 81.2562 |