| Red | Green | Blue | |
| z | 17.64 | ||
| znorm | Inf | ||
| sky | -Inf | -Inf | -NaN |
| S/N | 28.0 | 49.7 | 52.5 |
| S/N(c) | 0.0 | 0.0 | 0.0 |
| SN(E/C) |
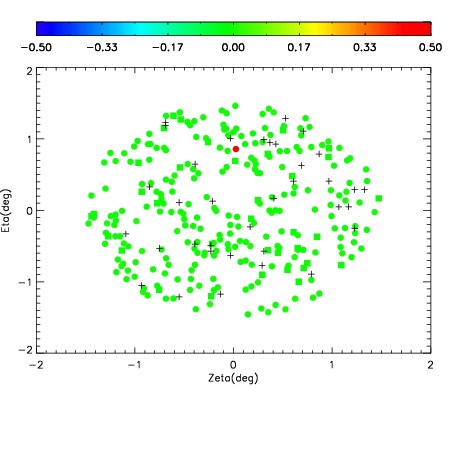
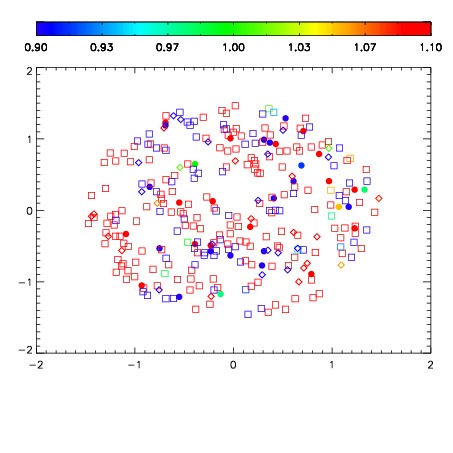
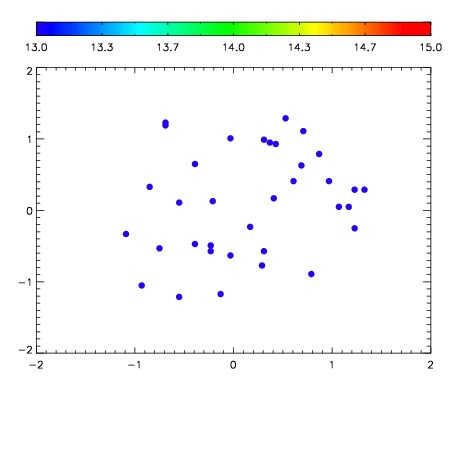

| Frame | Nreads | Zeropoints | Mag plots | Spatial mag deviation | Spatial sky 16325A emission deviations (filled: sky, open: star) | Spatial sky continuum emission | Spatial sky telluric CO2 absorption deviations (filled: H < 10) | |||||||||||||||||||||||
| 0 | 0 |
|
|
|
|
|
|
| IPAIR | NAME | SHIFT | NEWSHIFT | S/N | NAME | SHIFT | NEWSHIFT | S/N |
| 0 | 11100064 | 0.473176 | 0.00000 | 182.673 | 11100059 | 0.00000 | 0.473176 | 177.364 |
| 1 | 11100065 | 0.472965 | 0.000211000 | 184.044 | 11100066 | -0.00226606 | 0.475442 | 180.395 |
| 2 | 11100060 | 0.470646 | 0.00253001 | 182.458 | 11100063 | -0.00196756 | 0.475144 | 176.277 |
| 3 | 11100061 | 0.470909 | 0.00226700 | 179.845 | 11100062 | -0.00204895 | 0.475225 | 174.351 |