| Red | Green | Blue | |
| z | 17.64 | ||
| znorm | Inf | ||
| sky | -Inf | -Inf | -Inf |
| S/N | 20.1 | 37.0 | 38.9 |
| S/N(c) | 0.0 | 0.0 | 0.0 |
| SN(E/C) |
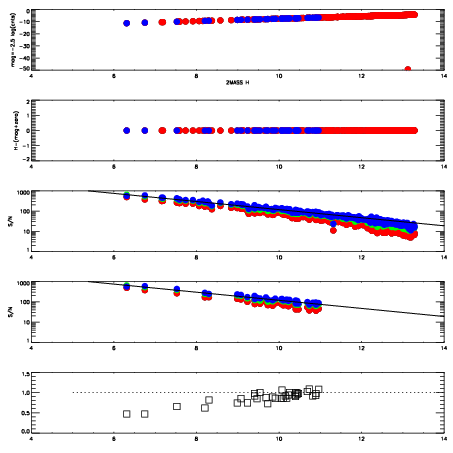
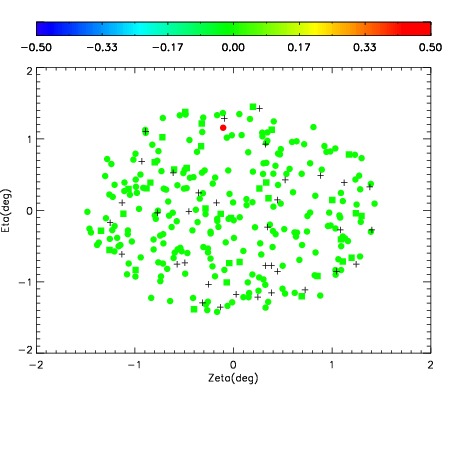
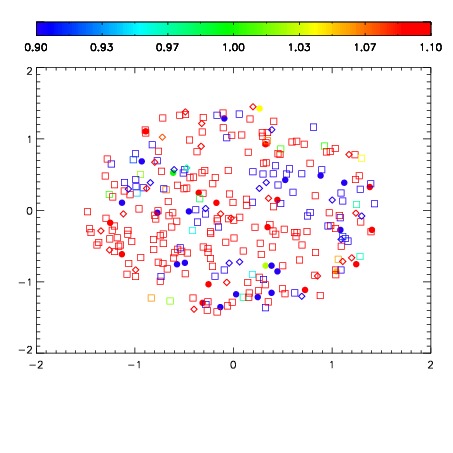
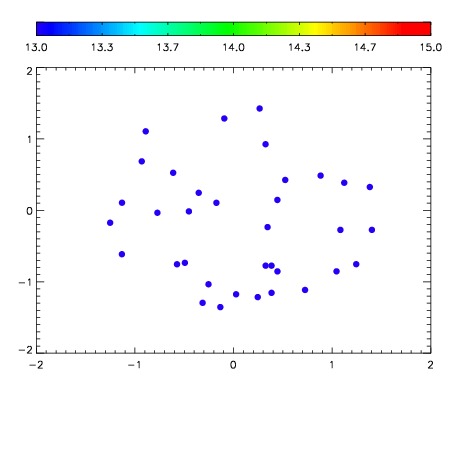

| Frame | Nreads | Zeropoints | Mag plots | Spatial mag deviation | Spatial sky 16325A emission deviations (filled: sky, open: star) | Spatial sky continuum emission | Spatial sky telluric CO2 absorption deviations (filled: H < 10) | |||||||||||||||||||||||
| 0 | 0 |
|
|
|
|
|
|
| IPAIR | NAME | SHIFT | NEWSHIFT | S/N | NAME | SHIFT | NEWSHIFT | S/N |
| 0 | 06770038 | 0.484058 | 0.00000 | 185.515 | 06770039 | 0.00268695 | 0.481371 | 165.891 |
| 1 | 06770042 | 0.483631 | 0.000426978 | 219.679 | 06770036 | 0.00000 | 0.484058 | 230.739 |
| 2 | 06770037 | 0.483845 | 0.000212997 | 192.901 | 06770043 | 0.00329445 | 0.480764 | 199.592 |
| 3 | 06770041 | 0.483377 | 0.000680983 | 173.577 | 06770040 | 0.000441569 | 0.483616 | 152.096 |