| Red | Green | Blue | |
| z | 17.64 | ||
| znorm | Inf | ||
| sky | -Inf | -NaN | -Inf |
| S/N | 28.5 | 49.0 | 57.0 |
| S/N(c) | 0.0 | 0.0 | 0.0 |
| SN(E/C) |
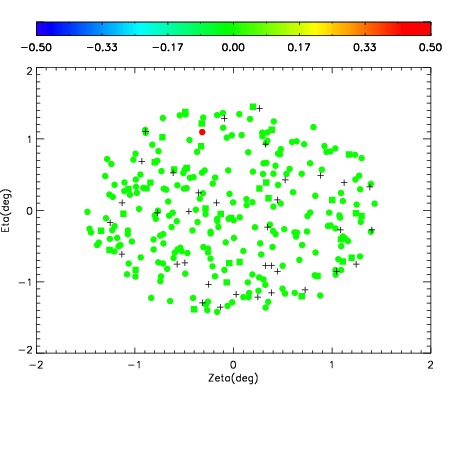
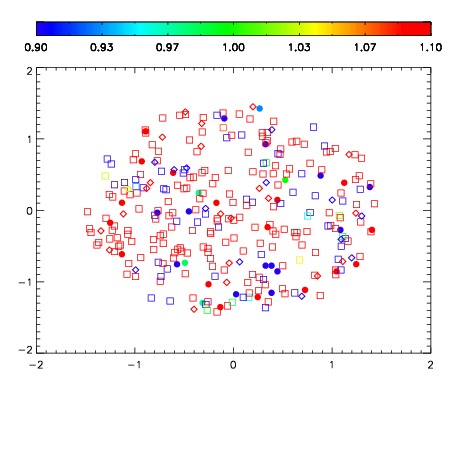
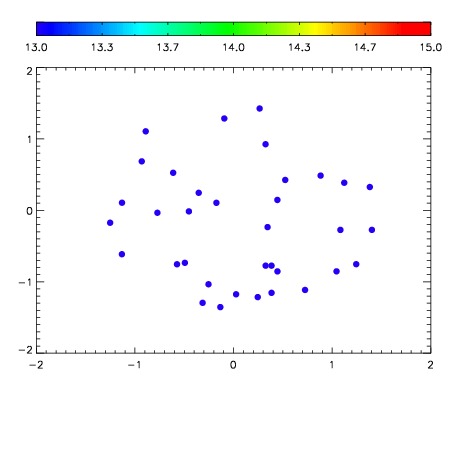

| Frame | Nreads | Zeropoints | Mag plots | Spatial mag deviation | Spatial sky 16325A emission deviations (filled: sky, open: star) | Spatial sky continuum emission | Spatial sky telluric CO2 absorption deviations (filled: H < 10) | |||||||||||||||||||||||
| 0 | 0 |
|
|
|
|
|
|
| IPAIR | NAME | SHIFT | NEWSHIFT | S/N | NAME | SHIFT | NEWSHIFT | S/N |
| 0 | 06970078 | 0.491839 | 0.00000 | 247.154 | 06970079 | 0.00219106 | 0.489648 | 251.044 |
| 1 | 06970074 | 0.489837 | 0.00200200 | 250.690 | 06970075 | 0.000923538 | 0.490915 | 253.140 |
| 2 | 06970073 | 0.489304 | 0.00253499 | 248.960 | 06970076 | 0.000820712 | 0.491018 | 252.232 |
| 3 | 06970077 | 0.490457 | 0.00138199 | 245.992 | 06970072 | 0.00000 | 0.491839 | 247.465 |