| Red | Green | Blue | |
| z | 17.64 | ||
| znorm | Inf | ||
| sky | -Inf | -Inf | -Inf |
| S/N | 26.2 | 45.6 | 47.8 |
| S/N(c) | 0.0 | 0.0 | 0.0 |
| SN(E/C) |
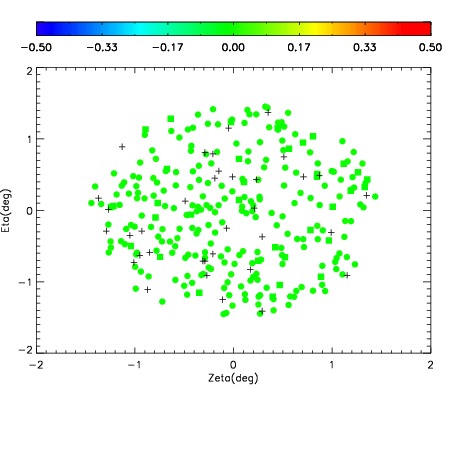
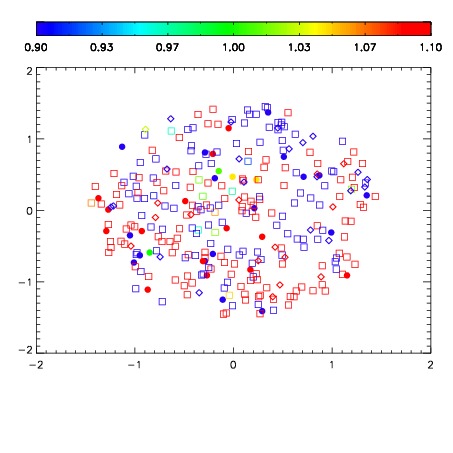
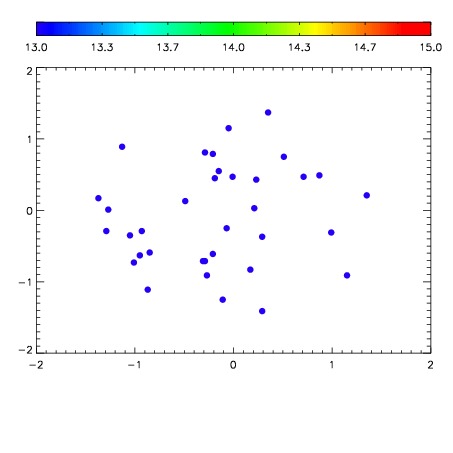

| Frame | Nreads | Zeropoints | Mag plots | Spatial mag deviation | Spatial sky 16325A emission deviations (filled: sky, open: star) | Spatial sky continuum emission | Spatial sky telluric CO2 absorption deviations (filled: H < 10) | |||||||||||||||||||||||
| 0 | 0 |
|
|
|
|
|
|
| IPAIR | NAME | SHIFT | NEWSHIFT | S/N | NAME | SHIFT | NEWSHIFT | S/N |
| 0 | 06740064 | 0.489399 | 0.00000 | 213.314 | 06740058 | 0.00000 | 0.489399 | 187.709 |
| 1 | 06740060 | 0.486698 | 0.00270098 | 220.213 | 06740061 | -0.000686694 | 0.490086 | 217.327 |
| 2 | 06740059 | 0.485596 | 0.00380298 | 215.815 | 06740062 | 0.00287983 | 0.486519 | 214.795 |
| 3 | 06740063 | 0.489115 | 0.000283986 | 213.337 | 06740065 | 0.00228528 | 0.487114 | 202.055 |