| Red | Green | Blue | |
| z | 17.64 | ||
| znorm | Inf | ||
| sky | -Inf | -Inf | -Inf |
| S/N | 28.3 | 48.3 | 53.2 |
| S/N(c) | 0.0 | 0.0 | 0.0 |
| SN(E/C) |
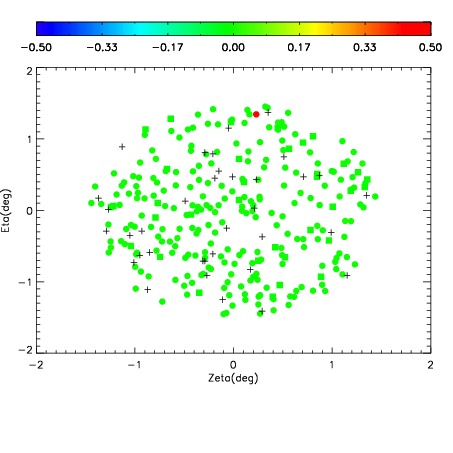

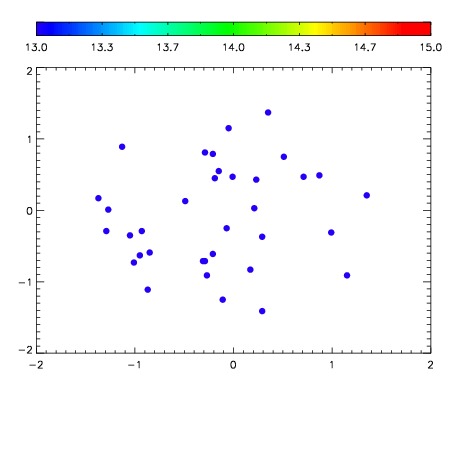

| Frame | Nreads | Zeropoints | Mag plots | Spatial mag deviation | Spatial sky 16325A emission deviations (filled: sky, open: star) | Spatial sky continuum emission | Spatial sky telluric CO2 absorption deviations (filled: H < 10) | |||||||||||||||||||||||
| 0 | 0 |
|
|
|
|
|
|
| IPAIR | NAME | SHIFT | NEWSHIFT | S/N | NAME | SHIFT | NEWSHIFT | S/N |
| 0 | 06940093 | 0.501388 | 0.00000 | 223.431 | 06940090 | 0.00419084 | 0.497197 | 222.570 |
| 1 | 06940092 | 0.501165 | 0.000223041 | 221.829 | 06940091 | 0.00362470 | 0.497763 | 219.312 |
| 2 | 06940089 | 0.498529 | 0.00285903 | 221.785 | 06940087 | 0.00000 | 0.501388 | 218.989 |
| 3 | 06940088 | 0.498118 | 0.00327000 | 219.377 | 06940094 | 0.00559109 | 0.495797 | 218.251 |