| Red | Green | Blue | |
| z | 17.64 | ||
| znorm | Inf | ||
| sky | -Inf | -Inf | -Inf |
| S/N | 34.0 | 56.3 | 64.3 |
| S/N(c) | 0.0 | 0.0 | 0.0 |
| SN(E/C) |
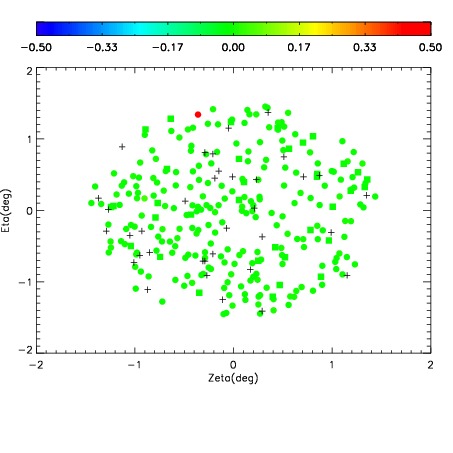
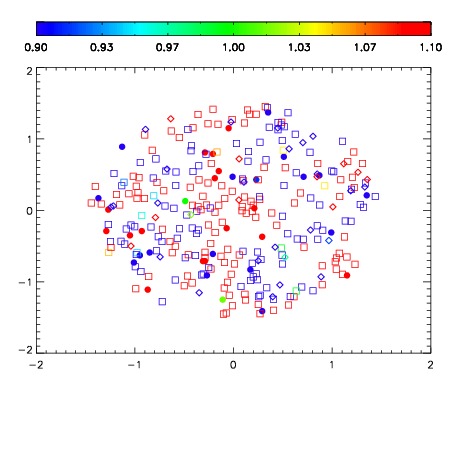
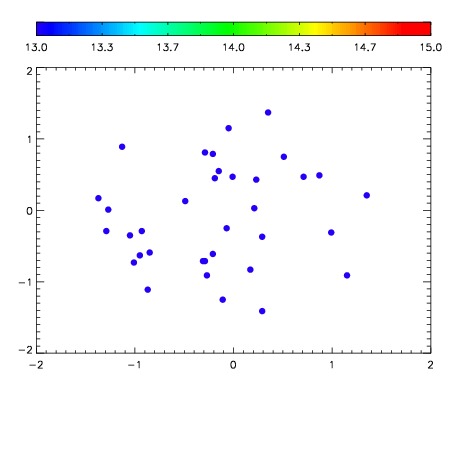

| Frame | Nreads | Zeropoints | Mag plots | Spatial mag deviation | Spatial sky 16325A emission deviations (filled: sky, open: star) | Spatial sky continuum emission | Spatial sky telluric CO2 absorption deviations (filled: H < 10) | |||||||||||||||||||||||
| 0 | 0 |
|
|
|
|
|
|
| IPAIR | NAME | SHIFT | NEWSHIFT | S/N | NAME | SHIFT | NEWSHIFT | S/N |
| 0 | 07000089 | 0.481873 | 0.00000 | 209.970 | 07000090 | -0.00184646 | 0.483719 | 210.061 |
| 1 | 07000093 | 0.479800 | 0.00207302 | 213.405 | 07000094 | -0.000986788 | 0.482860 | 215.502 |
| 2 | 07000085 | 0.481551 | 0.000322014 | 208.916 | 07000091 | -0.00461711 | 0.486490 | 201.837 |
| 3 | 07000084 | 0.481186 | 0.000687003 | 202.785 | 07000086 | 0.000462473 | 0.481411 | 200.295 |
| 4 | 07000092 | 0.478410 | 0.00346300 | 202.465 | 07000083 | 0.00000 | 0.481873 | 195.570 |
| 5 | 07000088 | 0.481376 | 0.000497013 | 201.022 | 07000087 | -0.00119079 | 0.483064 | 190.427 |