| Red | Green | Blue | |
| z | 17.64 | ||
| znorm | Inf | ||
| sky | -Inf | -Inf | -Inf |
| S/N | 28.7 | 48.2 | 54.4 |
| S/N(c) | 0.0 | 0.0 | 0.0 |
| SN(E/C) |
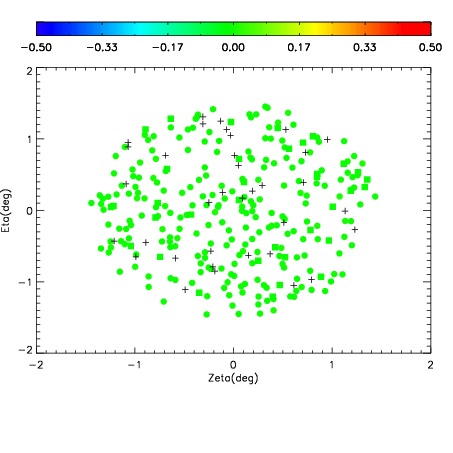
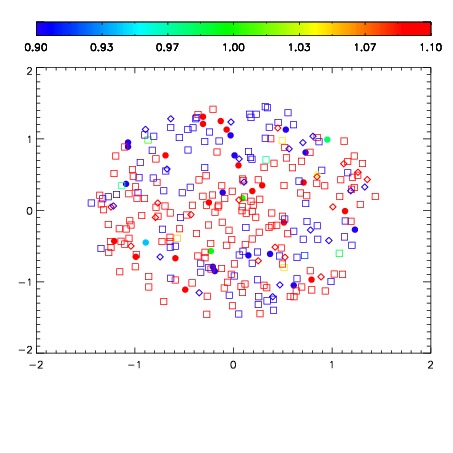
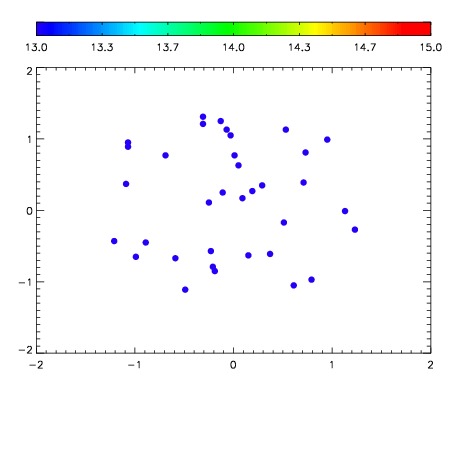

| Frame | Nreads | Zeropoints | Mag plots | Spatial mag deviation | Spatial sky 16325A emission deviations (filled: sky, open: star) | Spatial sky continuum emission | Spatial sky telluric CO2 absorption deviations (filled: H < 10) | |||||||||||||||||||||||
| 0 | 0 |
|
|
|
|
|
|
| IPAIR | NAME | SHIFT | NEWSHIFT | S/N | NAME | SHIFT | NEWSHIFT | S/N |
| 0 | 06760042 | 0.491994 | 0.00000 | 227.365 | 06760043 | 0.00245780 | 0.489536 | 227.385 |
| 1 | 06760041 | 0.491740 | 0.000254005 | 226.310 | 06760039 | 0.00389422 | 0.488100 | 222.626 |
| 2 | 06760038 | 0.489556 | 0.00243798 | 221.024 | 06760040 | 0.00287009 | 0.489124 | 222.475 |
| 3 | 06760037 | 0.489465 | 0.00252900 | 220.964 | 06760036 | 0.00000 | 0.491994 | 220.774 |