| Red | Green | Blue | |
| z | 17.64 | ||
| znorm | Inf | ||
| sky | -Inf | -Inf | -Inf |
| S/N | 35.2 | 57.2 | 66.0 |
| S/N(c) | 0.0 | 0.0 | 0.0 |
| SN(E/C) |
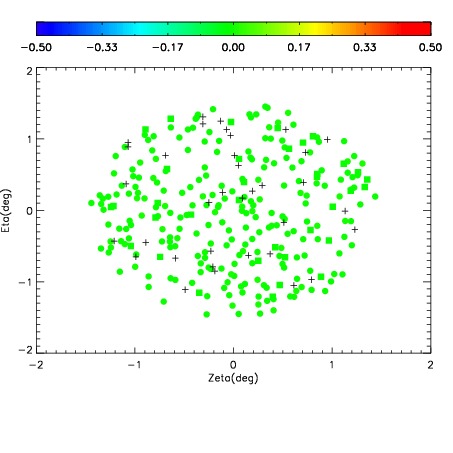

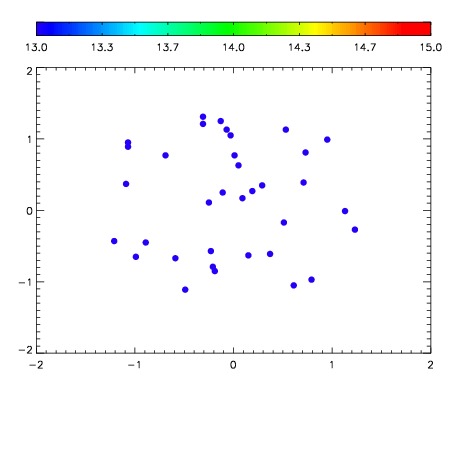

| Frame | Nreads | Zeropoints | Mag plots | Spatial mag deviation | Spatial sky 16325A emission deviations (filled: sky, open: star) | Spatial sky continuum emission | Spatial sky telluric CO2 absorption deviations (filled: H < 10) | |||||||||||||||||||||||
| 0 | 0 |
|
|
|
|
|
|
| IPAIR | NAME | SHIFT | NEWSHIFT | S/N | NAME | SHIFT | NEWSHIFT | S/N |
| 0 | 06950092 | 0.500681 | 0.00000 | 238.069 | 06950093 | 0.00902997 | 0.491651 | 238.085 |
| 1 | 06950091 | 0.499529 | 0.00115198 | 236.782 | 06950090 | 0.00594645 | 0.494735 | 233.889 |
| 2 | 06950088 | 0.498531 | 0.00214997 | 234.366 | 06950089 | 0.00724120 | 0.493440 | 232.904 |
| 3 | 06950087 | 0.497305 | 0.00337598 | 232.114 | 06950086 | 0.00479326 | 0.495888 | 231.895 |
| 4 | 06950084 | 0.498101 | 0.00257999 | 224.635 | 06950085 | 0.00668880 | 0.493992 | 227.471 |
| 5 | 06950083 | 0.497748 | 0.00293300 | 221.093 | 06950082 | 0.00000 | 0.500681 | 215.240 |