| Red | Green | Blue | |
| z | 17.64 | ||
| znorm | Inf | ||
| sky | -Inf | -Inf | -Inf |
| S/N | 22.8 | 39.8 | 45.5 |
| S/N(c) | 0.0 | 0.0 | 0.0 |
| SN(E/C) |

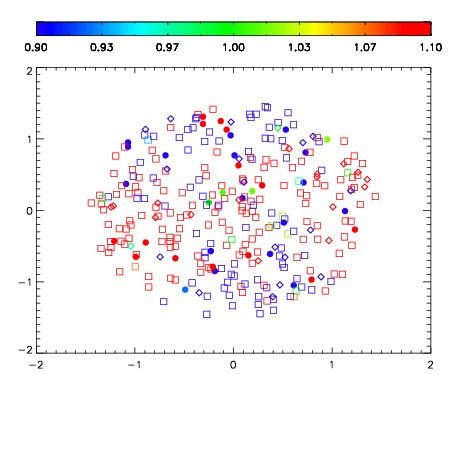
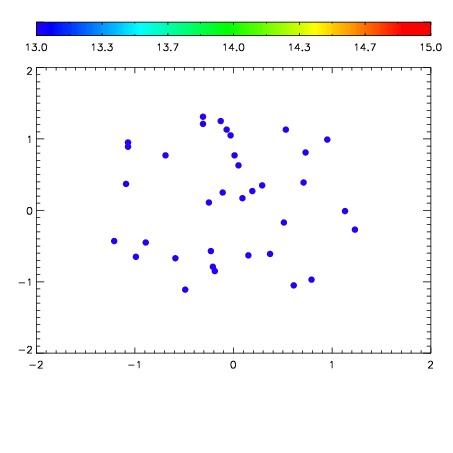

| Frame | Nreads | Zeropoints | Mag plots | Spatial mag deviation | Spatial sky 16325A emission deviations (filled: sky, open: star) | Spatial sky continuum emission | Spatial sky telluric CO2 absorption deviations (filled: H < 10) | |||||||||||||||||||||||
| 0 | 0 |
|
|
|
|
|
|
| IPAIR | NAME | SHIFT | NEWSHIFT | S/N | NAME | SHIFT | NEWSHIFT | S/N |
| 0 | 07020065 | 0.478499 | 0.00000 | 195.079 | 07020063 | 0.00210095 | 0.476398 | 192.481 |
| 1 | 07020060 | 0.474160 | 0.00433901 | 206.607 | 07020059 | 0.00000 | 0.478499 | 208.863 |
| 2 | 07020061 | 0.475112 | 0.00338700 | 200.574 | 07020066 | 0.00369216 | 0.474807 | 197.732 |
| 3 | 07020064 | 0.477946 | 0.000552982 | 195.408 | 07020062 | 0.00244981 | 0.476049 | 197.271 |