| Red | Green | Blue | |
| z | 17.64 | ||
| znorm | Inf | ||
| sky | -Inf | -Inf | -Inf |
| S/N | 31.8 | 52.6 | 57.8 |
| S/N(c) | 0.0 | 0.0 | 0.0 |
| SN(E/C) |
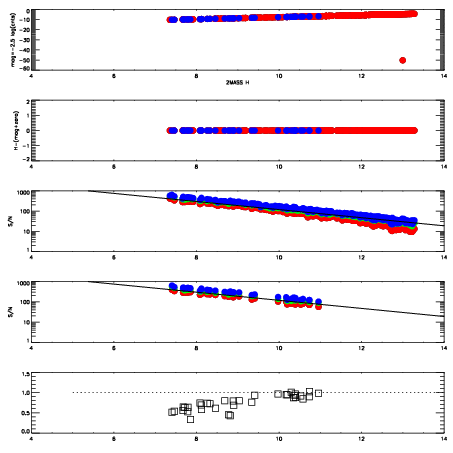

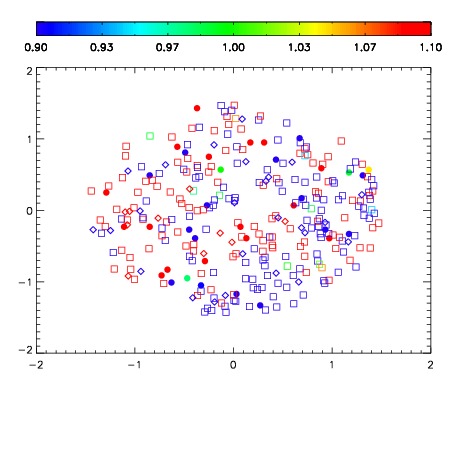
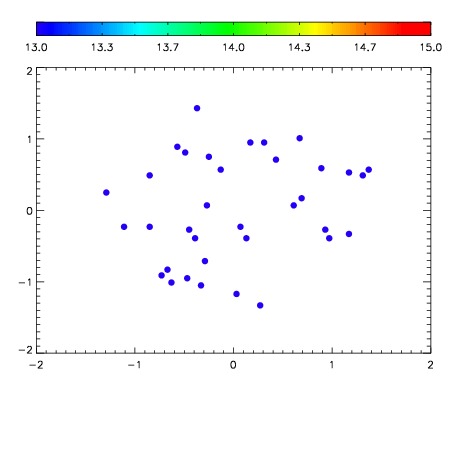

| Frame | Nreads | Zeropoints | Mag plots | Spatial mag deviation | Spatial sky 16325A emission deviations (filled: sky, open: star) | Spatial sky continuum emission | Spatial sky telluric CO2 absorption deviations (filled: H < 10) | |||||||||||||||||||||||
| 0 | 0 |
|
|
|
|
|
|
| IPAIR | NAME | SHIFT | NEWSHIFT | S/N | NAME | SHIFT | NEWSHIFT | S/N |
| 0 | 06730065 | 0.492357 | 0.00000 | 186.225 | 06730066 | 0.00818648 | 0.484170 | 184.380 |
| 1 | 06730060 | 0.490865 | 0.00149199 | 196.520 | 06730062 | -0.000173921 | 0.492531 | 197.324 |
| 2 | 06730061 | 0.492322 | 3.49879e-05 | 190.858 | 06730059 | 0.00000 | 0.492357 | 194.002 |
| 3 | 06730064 | 0.489803 | 0.00255400 | 188.843 | 06730063 | -0.000630945 | 0.492988 | 193.811 |