| Red | Green | Blue | |
| z | 17.64 | ||
| znorm | Inf | ||
| sky | -Inf | -Inf | -Inf |
| S/N | 28.3 | 46.3 | 50.2 |
| S/N(c) | 0.0 | 0.0 | 0.0 |
| SN(E/C) |
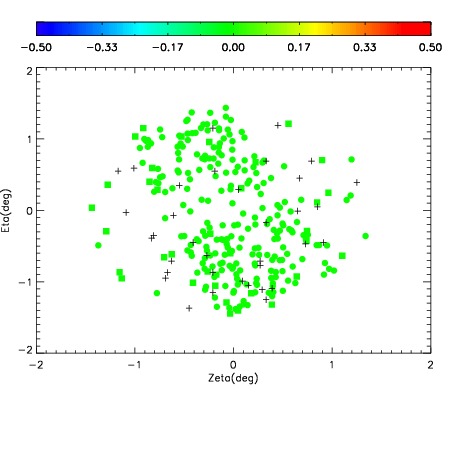
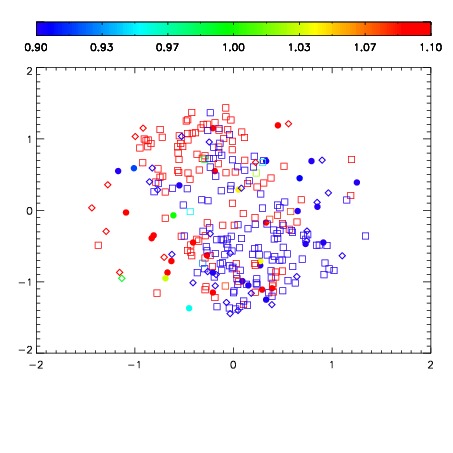
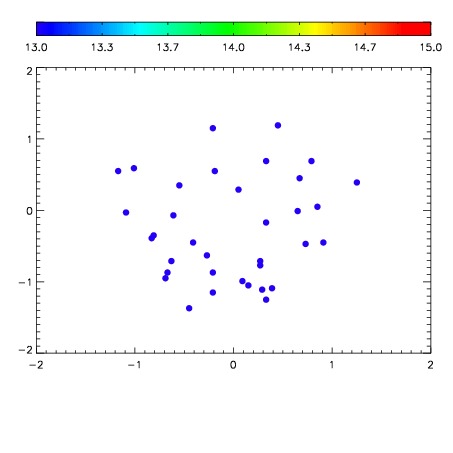

| Frame | Nreads | Zeropoints | Mag plots | Spatial mag deviation | Spatial sky 16325A emission deviations (filled: sky, open: star) | Spatial sky continuum emission | Spatial sky telluric CO2 absorption deviations (filled: H < 10) | |||||||||||||||||||||||
| 0 | 0 |
|
|
|
|
|
|
| IPAIR | NAME | SHIFT | NEWSHIFT | S/N | NAME | SHIFT | NEWSHIFT | S/N |
| 0 | 06330015 | 0.468293 | 0.00000 | 207.737 | 06330016 | -0.00541518 | 0.473708 | 203.222 |
| 1 | 06330014 | 0.467340 | 0.000953019 | 202.118 | 06330013 | -0.00712318 | 0.475416 | 189.726 |
| 2 | 06330010 | 0.466627 | 0.00166601 | 191.907 | 06330012 | -0.00729540 | 0.475588 | 189.537 |
| 3 | 06330011 | 0.467709 | 0.000584006 | 183.375 | 06330009 | 0.00000 | 0.468293 | 149.122 |