| Red | Green | Blue | |
| z | 17.64 | ||
| znorm | Inf | ||
| sky | -Inf | -Inf | -Inf |
| S/N | 33.8 | 55.4 | 59.8 |
| S/N(c) | 0.0 | 0.0 | 0.0 |
| SN(E/C) |
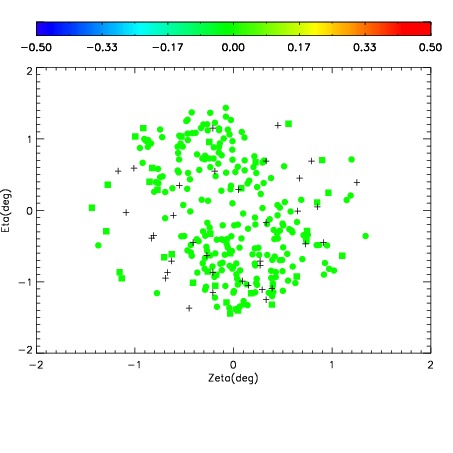
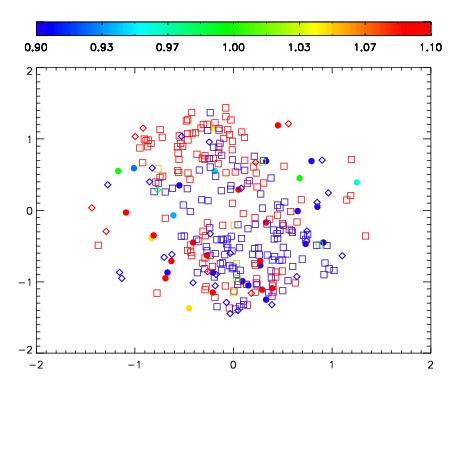


| Frame | Nreads | Zeropoints | Mag plots | Spatial mag deviation | Spatial sky 16325A emission deviations (filled: sky, open: star) | Spatial sky continuum emission | Spatial sky telluric CO2 absorption deviations (filled: H < 10) | |||||||||||||||||||||||
| 0 | 0 |
|
|
|
|
|
|
| IPAIR | NAME | SHIFT | NEWSHIFT | S/N | NAME | SHIFT | NEWSHIFT | S/N |
| 0 | 06340016 | 0.473002 | 0.00000 | 214.928 | 06340017 | -0.000507151 | 0.473509 | 214.794 |
| 1 | 06340015 | 0.472833 | 0.000168979 | 213.784 | 06340014 | -0.000634660 | 0.473637 | 213.739 |
| 2 | 06340012 | 0.471802 | 0.00119999 | 212.860 | 06340013 | 0.00134694 | 0.471655 | 212.476 |
| 3 | 06340011 | 0.470668 | 0.00233400 | 211.389 | 06340010 | 0.00000 | 0.473002 | 208.284 |