| Red | Green | Blue | |
| z | 17.64 | ||
| znorm | Inf | ||
| sky | -Inf | -Inf | -Inf |
| S/N | 29.5 | 49.3 | 51.5 |
| S/N(c) | 0.0 | 0.0 | 0.0 |
| SN(E/C) |
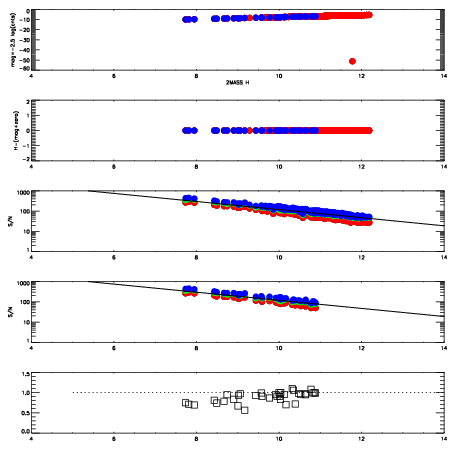
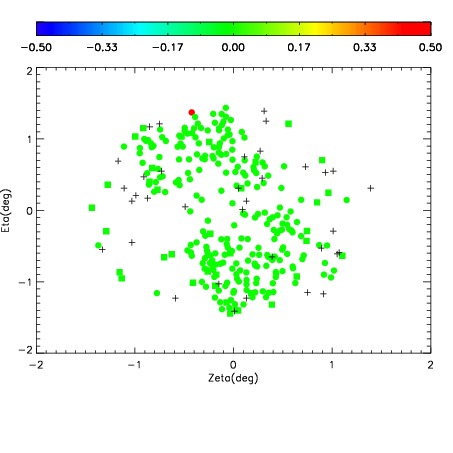
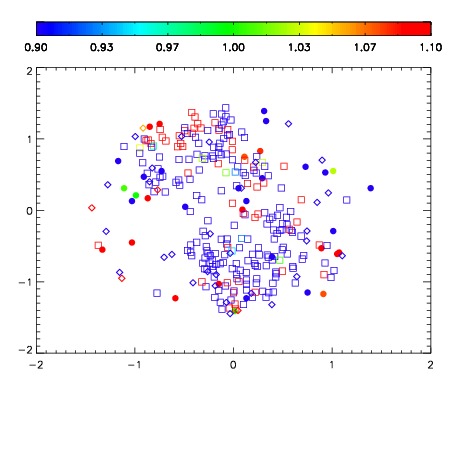
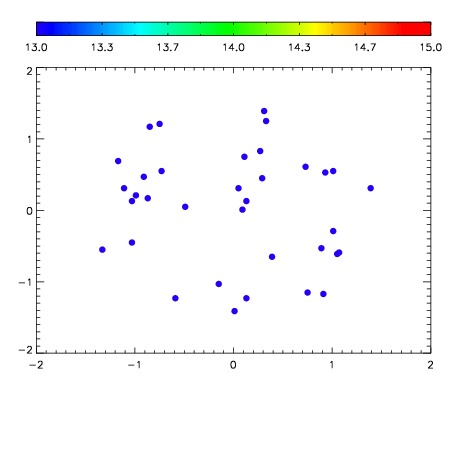

| Frame | Nreads | Zeropoints | Mag plots | Spatial mag deviation | Spatial sky 16325A emission deviations (filled: sky, open: star) | Spatial sky continuum emission | Spatial sky telluric CO2 absorption deviations (filled: H < 10) | |||||||||||||||||||||||
| 0 | 0 |
|
|
|
|
|
|
| IPAIR | NAME | SHIFT | NEWSHIFT | S/N | NAME | SHIFT | NEWSHIFT | S/N |
| 0 | 06390013 | 0.483439 | 0.00000 | 177.365 | 06390014 | -0.000896156 | 0.484335 | 174.180 |
| 1 | 06390012 | 0.483175 | 0.000263989 | 180.327 | 06390018 | 0.000163384 | 0.483276 | 183.714 |
| 2 | 06390016 | 0.480122 | 0.00331700 | 174.181 | 06390015 | -3.32476e-06 | 0.483442 | 172.945 |
| 3 | 06390017 | 0.480345 | 0.00309399 | 174.028 | 06390011 | 0.00000 | 0.483439 | 170.275 |