| Red | Green | Blue | |
| z | 17.64 | ||
| znorm | Inf | ||
| sky | -Inf | -Inf | -Inf |
| S/N | 25.2 | 44.3 | 45.8 |
| S/N(c) | 0.0 | 0.0 | 0.0 |
| SN(E/C) |
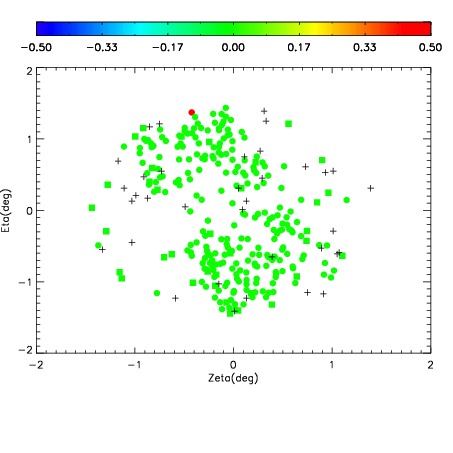
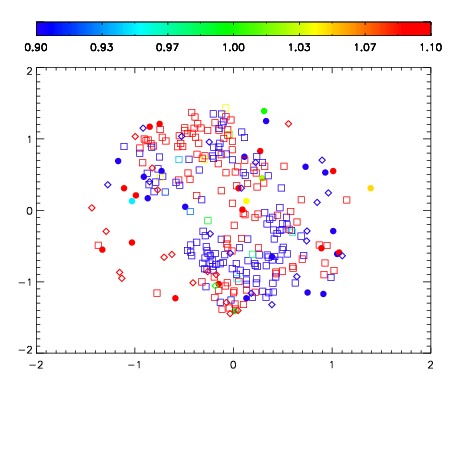
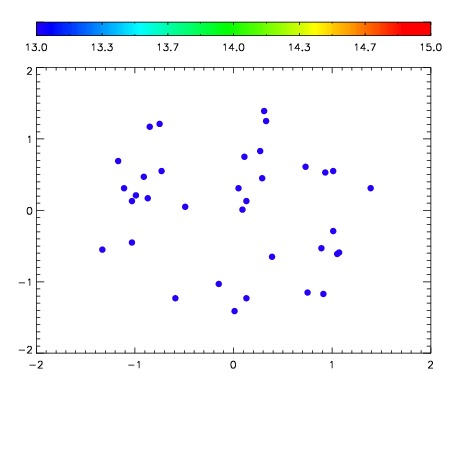

| Frame | Nreads | Zeropoints | Mag plots | Spatial mag deviation | Spatial sky 16325A emission deviations (filled: sky, open: star) | Spatial sky continuum emission | Spatial sky telluric CO2 absorption deviations (filled: H < 10) | |||||||||||||||||||||||
| 0 | 0 |
|
|
|
|
|
|
| IPAIR | NAME | SHIFT | NEWSHIFT | S/N | NAME | SHIFT | NEWSHIFT | S/N |
| 0 | 06400014 | 0.467819 | 0.00000 | 162.600 | 06400019 | -0.00971240 | 0.477531 | 161.362 |
| 1 | 06400017 | 0.467394 | 0.000425011 | 170.270 | 06400016 | -0.000428899 | 0.468248 | 163.156 |
| 2 | 06400018 | 0.467757 | 6.20186e-05 | 164.869 | 06400015 | -0.00982619 | 0.477645 | 161.545 |
| 3 | 06400013 | 0.467655 | 0.000164002 | 154.485 | 06400012 | 0.00000 | 0.467819 | 154.067 |