| Red | Green | Blue | |
| z | 17.64 | ||
| znorm | Inf | ||
| sky | -Inf | -Inf | -Inf |
| S/N | 33.9 | 55.3 | 59.1 |
| S/N(c) | 0.0 | 0.0 | 0.0 |
| SN(E/C) |
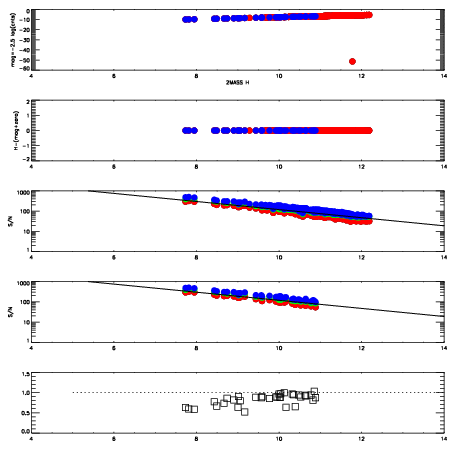
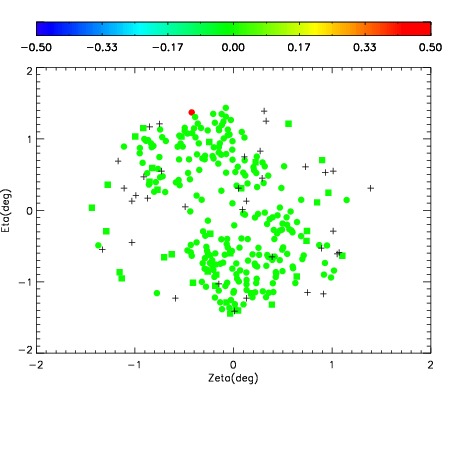
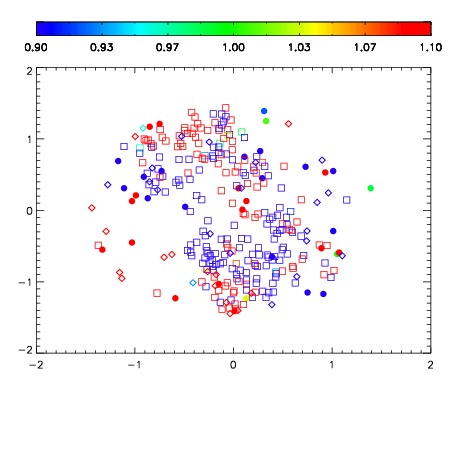
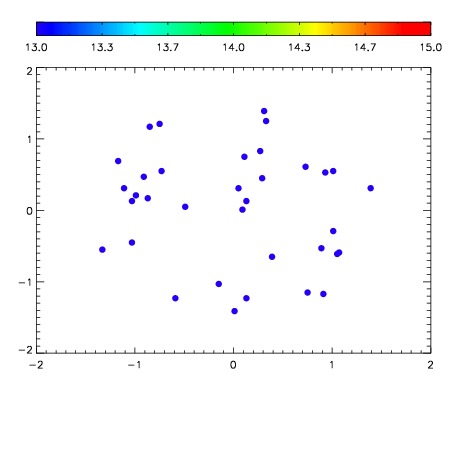

| Frame | Nreads | Zeropoints | Mag plots | Spatial mag deviation | Spatial sky 16325A emission deviations (filled: sky, open: star) | Spatial sky continuum emission | Spatial sky telluric CO2 absorption deviations (filled: H < 10) | |||||||||||||||||||||||
| 0 | 0 |
|
|
|
|
|
|
| IPAIR | NAME | SHIFT | NEWSHIFT | S/N | NAME | SHIFT | NEWSHIFT | S/N |
| 0 | 06410016 | 0.480094 | 0.00000 | 195.012 | 06410014 | 0.000311174 | 0.479783 | 195.757 |
| 1 | 06410012 | 0.479497 | 0.000597000 | 195.842 | 06410013 | -0.000776927 | 0.480871 | 196.219 |
| 2 | 06410011 | 0.479005 | 0.00108898 | 194.530 | 06410017 | 0.00254771 | 0.477546 | 194.113 |
| 3 | 06410015 | 0.479409 | 0.000684977 | 193.670 | 06410010 | 0.00000 | 0.480094 | 191.899 |