| Red | Green | Blue | |
| z | 17.64 | ||
| znorm | Inf | ||
| sky | -Inf | -Inf | -Inf |
| S/N | 29.7 | 51.1 | 53.6 |
| S/N(c) | 0.0 | 0.0 | 0.0 |
| SN(E/C) |

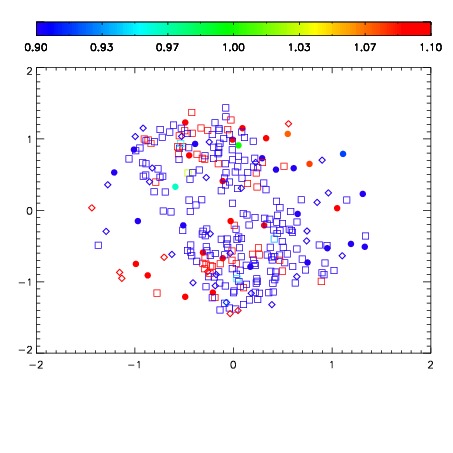
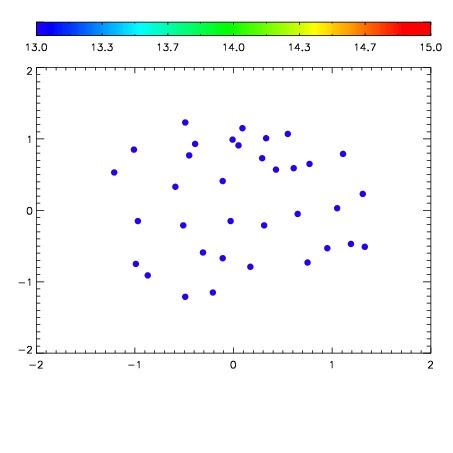

| Frame | Nreads | Zeropoints | Mag plots | Spatial mag deviation | Spatial sky 16325A emission deviations (filled: sky, open: star) | Spatial sky continuum emission | Spatial sky telluric CO2 absorption deviations (filled: H < 10) | |||||||||||||||||||||||
| 0 | 0 |
|
|
|
|
|
|
| IPAIR | NAME | SHIFT | NEWSHIFT | S/N | NAME | SHIFT | NEWSHIFT | S/N |
| 0 | 08720039 | 0.473716 | 0.00000 | 208.255 | 08720036 | 0.00267536 | 0.471041 | 206.621 |
| 1 | 08720038 | 0.473176 | 0.000539988 | 211.788 | 08720037 | 0.00372252 | 0.469993 | 212.289 |
| 2 | 08720035 | 0.471143 | 0.00257298 | 210.672 | 08720040 | 1.38854e-05 | 0.473702 | 210.950 |
| 3 | 08720034 | 0.469775 | 0.00394100 | 210.445 | 08720033 | 0.00000 | 0.473716 | 210.482 |