| Red | Green | Blue | |
| z | 17.64 | ||
| znorm | Inf | ||
| sky | -Inf | -Inf | -Inf |
| S/N | 18.8 | 33.1 | 40.8 |
| S/N(c) | 0.0 | 0.0 | 0.0 |
| SN(E/C) |
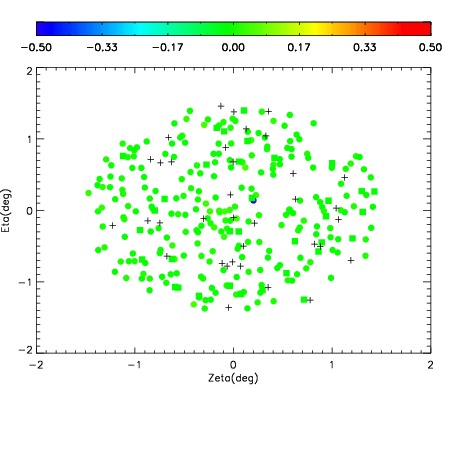
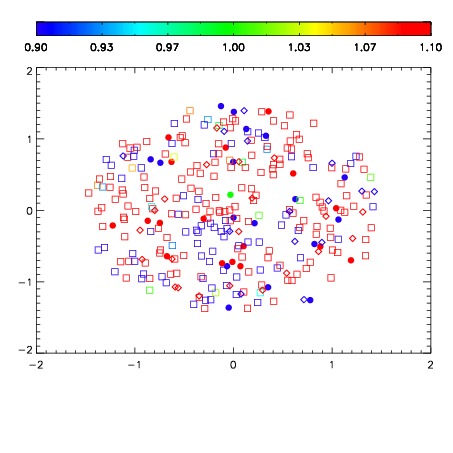
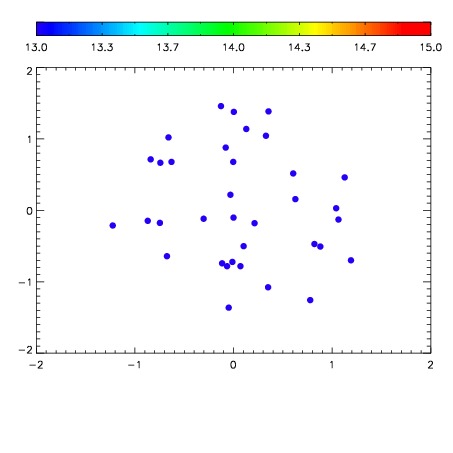

| Frame | Nreads | Zeropoints | Mag plots | Spatial mag deviation | Spatial sky 16325A emission deviations (filled: sky, open: star) | Spatial sky continuum emission | Spatial sky telluric CO2 absorption deviations (filled: H < 10) | |||||||||||||||||||||||
| 0 | 0 |
|
|
|
|
|
|
| IPAIR | NAME | SHIFT | NEWSHIFT | S/N | NAME | SHIFT | NEWSHIFT | S/N |
| 0 | 07220028 | 0.480541 | 0.00000 | 128.303 | 07220025 | 0.000702692 | 0.479838 | 131.415 |
| 1 | 07220027 | 0.480358 | 0.000182986 | 140.824 | 07220022 | 0.00000 | 0.480541 | 132.313 |
| 2 | 07220024 | 0.480168 | 0.000372976 | 139.711 | 07220026 | 0.00350759 | 0.477033 | 131.533 |
| 3 | 07220023 | 0.479528 | 0.00101298 | 121.839 | 07220029 | 0.00397492 | 0.476566 | 123.549 |